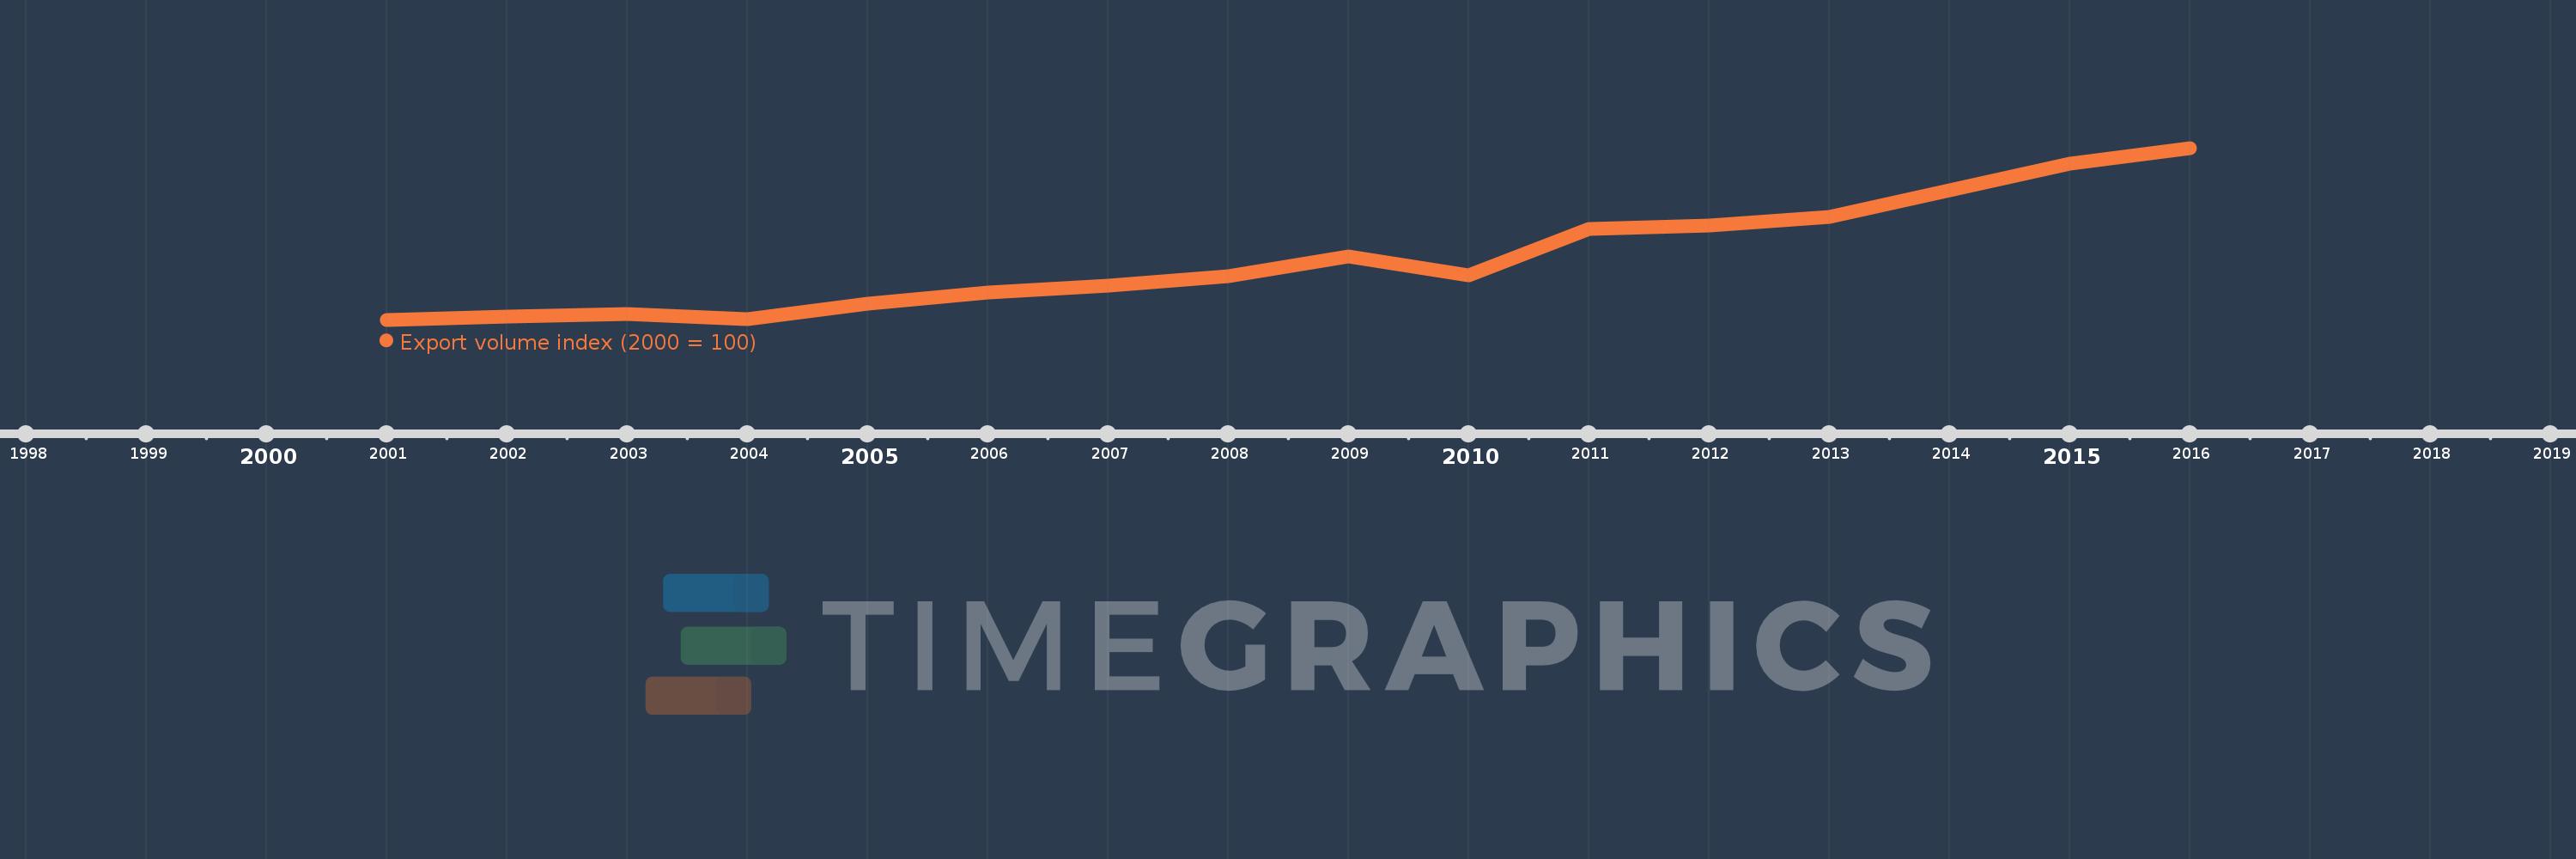
This timeline shows a graph from 2001 to 2016 of Australia. No data until 2000. Number of actual observations by date: 16.
Source name:
World Development Indicators
Source organization:
United Nations Conference on Trade and Development, Handbook of Statistics and data files, and International Monetary Fund, International Financial Statistics.
Categories, topics:
Private Sector, Trade
Last updated:
apr 23, 2017
Indicators value changes by year
Meaning:
119.467
Minimum:
100.0
jan 1, 2001
Maximum:
154.312
jan 1, 2016
At the date of observation
Value
Absolute change
Change from the previous value
jan 1, 2001
100.0
+100.0
0.0%
jan 1, 2002
101.088
+1.088
1.09%
jan 1, 2003
101.793
+0.705
0.7%
jan 1, 2004
100.255
-1.538
-1.51%
jan 1, 2005
104.961
+4.705
4.69%
jan 1, 2006
108.635
+3.674
3.5%
jan 1, 2007
110.892
+2.257
2.08%
jan 1, 2008
113.651
+2.759
2.49%
jan 1, 2009
120.146
+6.495
5.72%
jan 1, 2010
114.168
-5.978
-4.98%
jan 1, 2011
128.73
+14.562
12.76%
jan 1, 2012
129.883
+1.153
0.9%
jan 1, 2013
132.624
+2.741
2.11%
jan 1, 2014
140.917
+8.293
6.25%
jan 1, 2015
149.414
+8.497
6.03%
jan 1, 2016
154.312
+4.899
3.28%
Ranking of countries by current statistics by years
