29
/
en
AIzaSyAYiBZKx7MnpbEhh9jyipgxe19OcubqV5w
April 1, 2024
107168
Colombia
COL
true
2
1
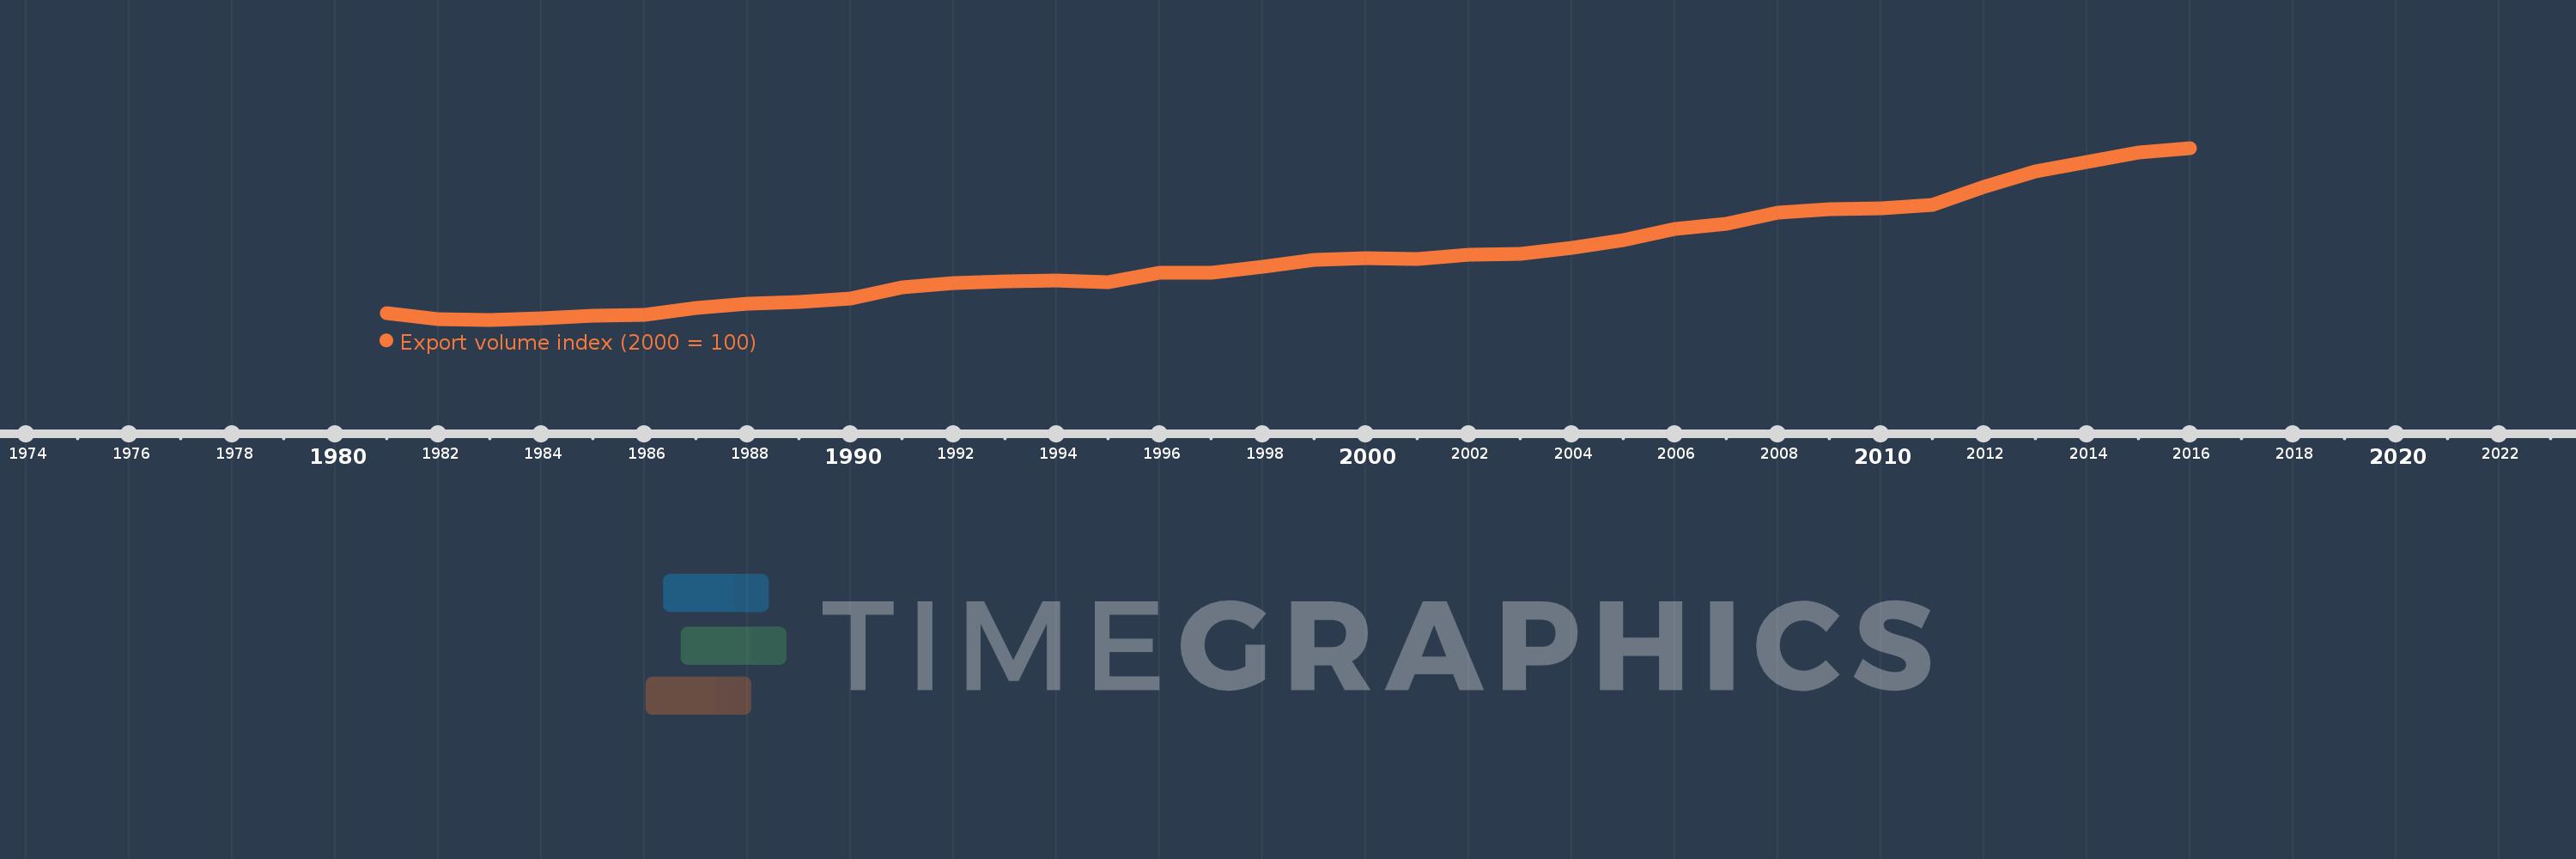
Export volume index (2000 = 100)
2016,2015,2014,2013,2012,2011,2010,2009,2008,2007,2006,2005,2004,2003,2002,2001,2000,1999,1998,1997,1996,1995,1994,1993,1992,1991,1990,1989,1988,1987,1986,1985,1984,1983,1982,1981
This statistics in other country:
AfghanistanAlbaniaAlgeriaAmerican SamoaAndorraAngolaAntigua and BarbudaArgentinaArmeniaArubaAustraliaAustriaAzerbaijanBahamas, TheBahrainBangladeshBarbadosBelarusBelgiumBelizeBeninBermudaBhutanBoliviaBosnia and HerzegovinaBotswanaBrazilBritish Virgin IslandsBrunei DarussalamBulgariaBurkina FasoBurundiCabo VerdeCambodiaCameroonCanadaCayman IslandsCentral African RepublicChadChileChinaColombiaComorosCongo, Dem. Rep.Congo, Rep.Costa RicaCote d'IvoireCroatiaCubaCuracaoCyprusCzech RepublicDenmarkDjiboutiDominicaDominican RepublicEcuadorEgypt, Arab Rep.El SalvadorEquatorial GuineaEritreaEstoniaEthiopiaFaroe IslandsFijiFinlandFranceFrench PolynesiaGabonGambia, TheGeorgiaGermanyGhanaGibraltarGreeceGreenlandGrenadaGuamGuatemalaGuineaGuinea-BissauGuyanaHaitiHondurasHong Kong SAR, ChinaHungaryIcelandIndiaIndonesiaIran, Islamic Rep.IraqIrelandIsraelItalyJamaicaJapanJordanKazakhstanKenyaKiribatiKorea, Dem. People’s Rep.Korea, Rep.KuwaitKyrgyz RepublicLao PDRLatviaLebanonLesothoLiberiaLibyaLithuaniaLuxembourgMacao SAR, ChinaMacedonia, FYRMadagascarMalawiMalaysiaMaldivesMaliMaltaMarshall IslandsMauritaniaMauritiusMexicoMicronesia, Fed. Sts.MoldovaMongoliaMoroccoMozambiqueMyanmarNamibiaNauruNepalNetherlandsNew CaledoniaNew ZealandNicaraguaNigerNigeriaNorthern Mariana IslandsNorwayOmanPakistanPalauPanamaPapua New GuineaParaguayPeruPhilippinesPolandPortugalQatarRomaniaRussian FederationRwandaSamoaSao Tome and PrincipeSaudi ArabiaSenegalSerbiaSeychellesSierra LeoneSingaporeSlovak RepublicSloveniaSolomon IslandsSomaliaSouth AfricaSpainSri LankaSt. Kitts and NevisSt. LuciaSt. Vincent and the GrenadinesSudanSurinameSwazilandSwedenSwitzerlandSyrian Arab RepublicTajikistanTanzaniaThailandTogoTongaTrinidad and TobagoTunisiaTurkeyTurkmenistanTurks and Caicos IslandsUgandaUkraineUnited Arab EmiratesUnited KingdomUnited StatesUruguayUzbekistanVanuatuVenezuela, RBVietnamWest Bank and GazaYemen, Rep.ZambiaZimbabwe Timeline:
This timeline shows a graph from 1981 to 2016 of Colombia. No data until 1980. Number of actual observations by date: 36.
Source name:
World Development Indicators
Source organization:
United Nations Conference on Trade and Development, Handbook of Statistics and data files, and International Monetary Fund, International Financial Statistics.
Categories, topics:
Private Sector, Trade
Last updated:
apr 23, 2017
Indicators value changes by year
Maximum:
230.291
jan 1, 2016
At the date of observation
Value
Absolute change
Change from previous value
jan 1, 1981
35.818
+35.818
0.0%
jan 1, 1982
29.037
-6.78
-18.93%
jan 1, 1983
28.27
-0.767
-2.64%
jan 1, 1984
29.493
+1.224
4.33%
jan 1, 1985
32.765
+3.271
11.09%
jan 1, 1986
34.467
+1.703
5.2%
jan 1, 1987
41.609
+7.142
20.72%
jan 1, 1988
46.83
+5.22
12.55%
jan 1, 1989
48.883
+2.053
4.38%
jan 1, 1990
53.448
+4.565
9.34%
jan 1, 1991
66.502
+13.055
24.43%
jan 1, 1992
71.086
+4.583
6.89%
jan 1, 1993
73.649
+2.563
3.61%
jan 1, 1994
74.734
+1.085
1.47%
jan 1, 1995
72.52
-2.214
-2.96%
jan 1, 1996
83.803
+11.283
15.56%
jan 1, 1997
83.678
-0.124
-0.15%
jan 1, 1998
90.142
+6.464
7.72%
jan 1, 1999
98.226
+8.083
8.97%
jan 1, 2000
100.848
+2.622
2.67%
jan 1, 2001
100.0
-0.848
-0.84%
jan 1, 2002
105.081
+5.081
5.08%
jan 1, 2003
105.715
+0.634
0.6%
jan 1, 2004
112.96
+7.246
6.85%
jan 1, 2005
121.573
+8.612
7.62%
jan 1, 2006
135.143
+13.57
11.16%
jan 1, 2007
140.666
+5.523
4.09%
jan 1, 2008
153.981
+13.315
9.47%
jan 1, 2009
158.562
+4.581
2.98%
jan 1, 2010
158.825
+0.263
0.17%
jan 1, 2011
162.897
+4.073
2.56%
jan 1, 2012
184.854
+21.957
13.48%
jan 1, 2013
202.826
+17.972
9.72%
jan 1, 2014
214.086
+11.26
5.55%
jan 1, 2015
224.455
+10.369
4.84%
jan 1, 2016
230.291
+5.836
2.6%
Ranking of countries by current statistics by years


Comments: