29
/
en
AIzaSyAYiBZKx7MnpbEhh9jyipgxe19OcubqV5w
April 1, 2024
113508
Cote d'Ivoire
CIV
true
2
1
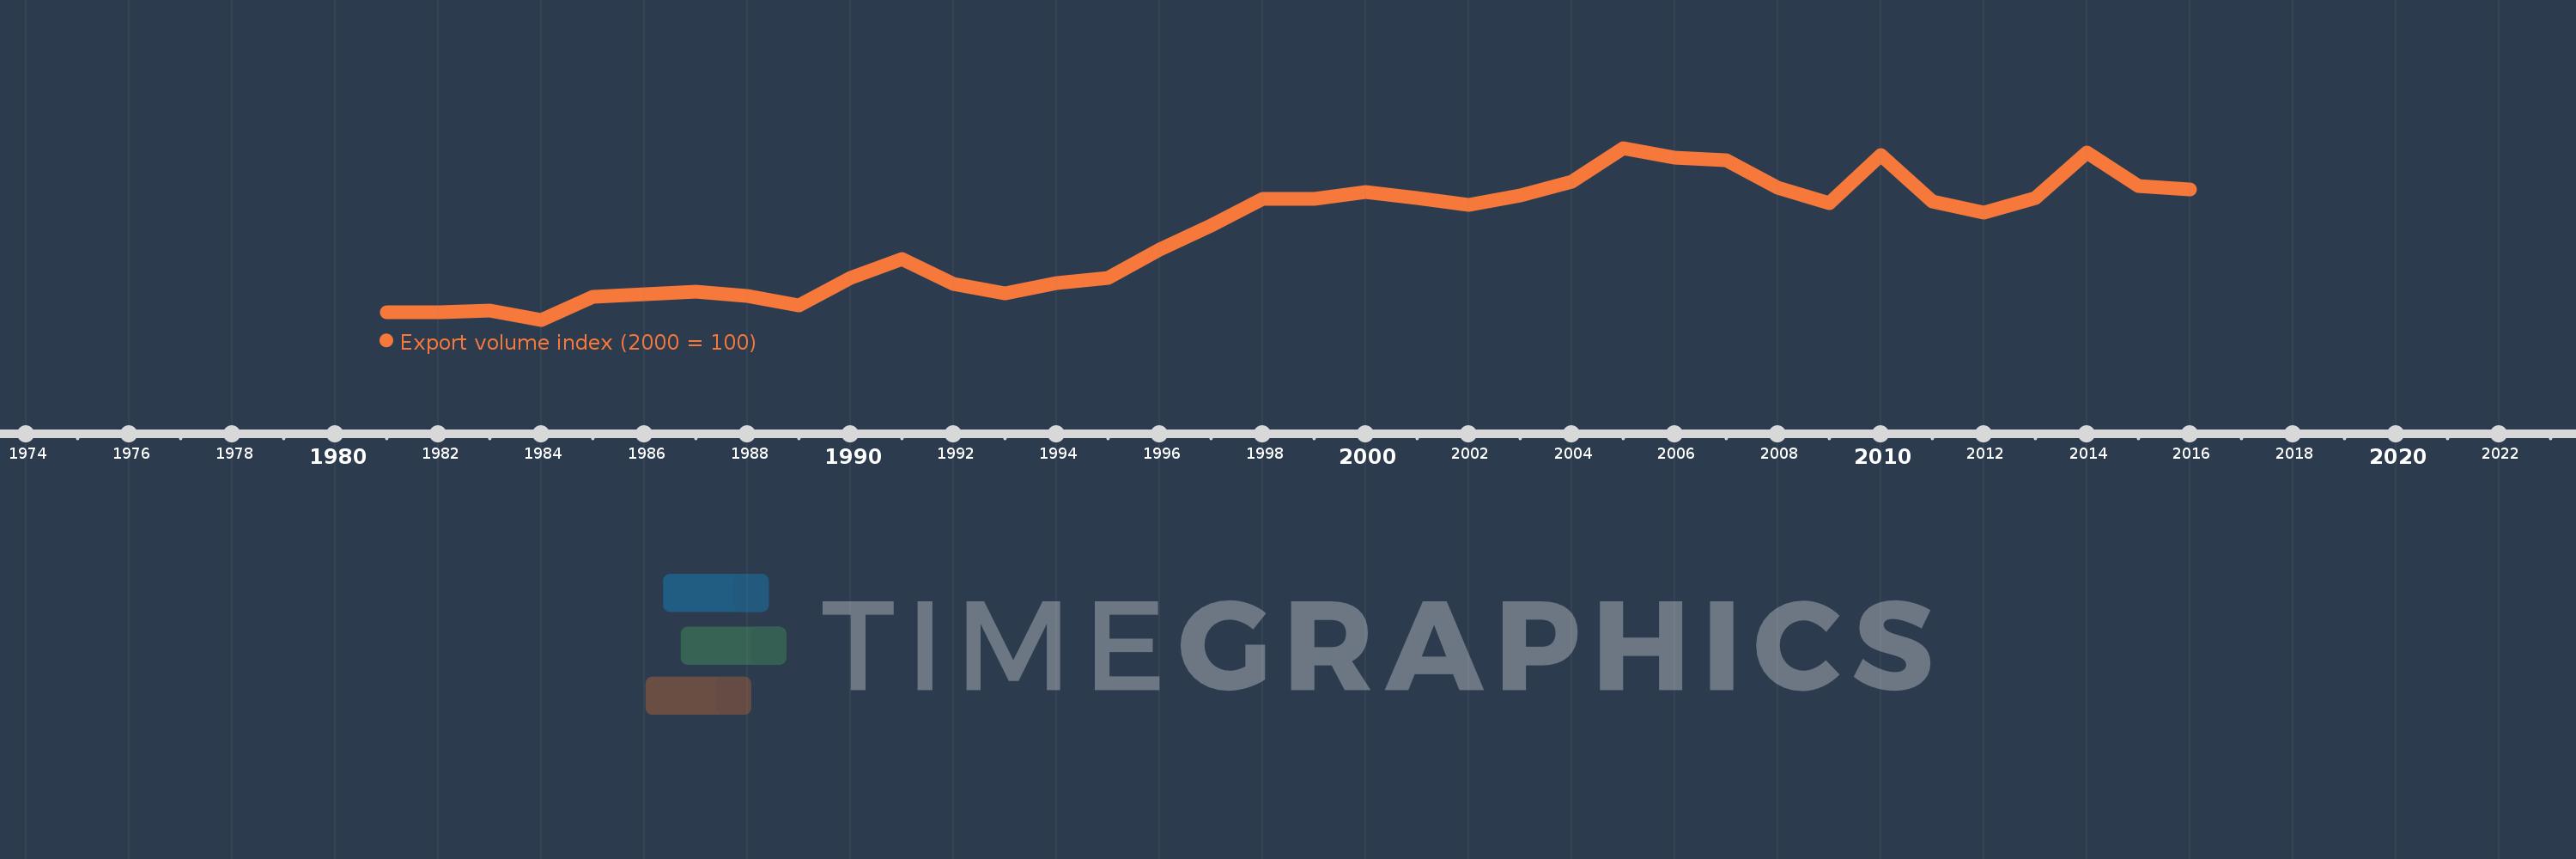
Export volume index (2000 = 100)
2016,2015,2014,2013,2012,2011,2010,2009,2008,2007,2006,2005,2004,2003,2002,2001,2000,1999,1998,1997,1996,1995,1994,1993,1992,1991,1990,1989,1988,1987,1986,1985,1984,1983,1982,1981
This statistics in other country:
AfghanistanAlbaniaAlgeriaAmerican SamoaAndorraAngolaAntigua and BarbudaArgentinaArmeniaArubaAustraliaAustriaAzerbaijanBahamas, TheBahrainBangladeshBarbadosBelarusBelgiumBelizeBeninBermudaBhutanBoliviaBosnia and HerzegovinaBotswanaBrazilBritish Virgin IslandsBrunei DarussalamBulgariaBurkina FasoBurundiCabo VerdeCambodiaCameroonCanadaCayman IslandsCentral African RepublicChadChileChinaColombiaComorosCongo, Dem. Rep.Congo, Rep.Costa RicaCote d'IvoireCroatiaCubaCuracaoCyprusCzech RepublicDenmarkDjiboutiDominicaDominican RepublicEcuadorEgypt, Arab Rep.El SalvadorEquatorial GuineaEritreaEstoniaEthiopiaFaroe IslandsFijiFinlandFranceFrench PolynesiaGabonGambia, TheGeorgiaGermanyGhanaGibraltarGreeceGreenlandGrenadaGuamGuatemalaGuineaGuinea-BissauGuyanaHaitiHondurasHong Kong SAR, ChinaHungaryIcelandIndiaIndonesiaIran, Islamic Rep.IraqIrelandIsraelItalyJamaicaJapanJordanKazakhstanKenyaKiribatiKorea, Dem. People’s Rep.Korea, Rep.KuwaitKyrgyz RepublicLao PDRLatviaLebanonLesothoLiberiaLibyaLithuaniaLuxembourgMacao SAR, ChinaMacedonia, FYRMadagascarMalawiMalaysiaMaldivesMaliMaltaMarshall IslandsMauritaniaMauritiusMexicoMicronesia, Fed. Sts.MoldovaMongoliaMoroccoMozambiqueMyanmarNamibiaNauruNepalNetherlandsNew CaledoniaNew ZealandNicaraguaNigerNigeriaNorthern Mariana IslandsNorwayOmanPakistanPalauPanamaPapua New GuineaParaguayPeruPhilippinesPolandPortugalQatarRomaniaRussian FederationRwandaSamoaSao Tome and PrincipeSaudi ArabiaSenegalSerbiaSeychellesSierra LeoneSingaporeSlovak RepublicSloveniaSolomon IslandsSomaliaSouth AfricaSpainSri LankaSt. Kitts and NevisSt. LuciaSt. Vincent and the GrenadinesSudanSurinameSwazilandSwedenSwitzerlandSyrian Arab RepublicTajikistanTanzaniaThailandTogoTongaTrinidad and TobagoTunisiaTurkeyTurkmenistanTurks and Caicos IslandsUgandaUkraineUnited Arab EmiratesUnited KingdomUnited StatesUruguayUzbekistanVanuatuVenezuela, RBVietnamWest Bank and GazaYemen, Rep.ZambiaZimbabwe Timeline:
This timeline shows a graph from 1981 to 2016 of Cote d'Ivoire. No data until 1980. Number of actual observations by date: 36.
Source name:
World Development Indicators
Source organization:
United Nations Conference on Trade and Development, Handbook of Statistics and data files, and International Monetary Fund, International Financial Statistics.
Categories, topics:
Private Sector, Trade
Last updated:
apr 23, 2017
Indicators value changes by year
Minimum:
53.236
jan 1, 1984
Maximum:
119.247
jan 1, 2005
At the date of observation
Value
Absolute change
Change from previous value
jan 1, 1981
55.994
+55.994
0.0%
jan 1, 1982
56.17
+0.176
0.32%
jan 1, 1983
56.833
+0.663
1.18%
jan 1, 1984
53.236
-3.598
-6.33%
jan 1, 1985
62.162
+8.926
16.77%
jan 1, 1986
63.119
+0.957
1.54%
jan 1, 1987
63.907
+0.788
1.25%
jan 1, 1988
62.486
-1.421
-2.22%
jan 1, 1989
58.878
-3.609
-5.78%
jan 1, 1990
69.43
+10.552
17.92%
jan 1, 1991
76.713
+7.283
10.49%
jan 1, 1992
67.073
-9.64
-12.57%
jan 1, 1993
63.205
-3.868
-5.77%
jan 1, 1994
67.479
+4.274
6.76%
jan 1, 1995
69.147
+1.667
2.47%
jan 1, 1996
80.235
+11.088
16.04%
jan 1, 1997
89.338
+9.103
11.35%
jan 1, 1998
99.554
+10.216
11.44%
jan 1, 1999
99.561
+0.007
0.01%
jan 1, 2000
102.473
+2.912
2.92%
jan 1, 2001
100.0
-2.473
-2.41%
jan 1, 2002
97.213
-2.787
-2.79%
jan 1, 2003
100.855
+3.642
3.75%
jan 1, 2004
106.214
+5.359
5.31%
jan 1, 2005
119.247
+13.032
12.27%
jan 1, 2006
115.611
-3.635
-3.05%
jan 1, 2007
114.507
-1.105
-0.96%
jan 1, 2008
103.976
-10.531
-9.2%
jan 1, 2009
97.923
-6.053
-5.82%
jan 1, 2010
116.352
+18.429
18.82%
jan 1, 2011
98.581
-17.771
-15.27%
jan 1, 2012
94.371
-4.209
-4.27%
jan 1, 2013
99.916
+5.544
5.87%
jan 1, 2014
117.394
+17.479
17.49%
jan 1, 2015
104.77
-12.624
-10.75%
jan 1, 2016
103.452
-1.318
-1.26%
Ranking of countries by current statistics by years


Comments: