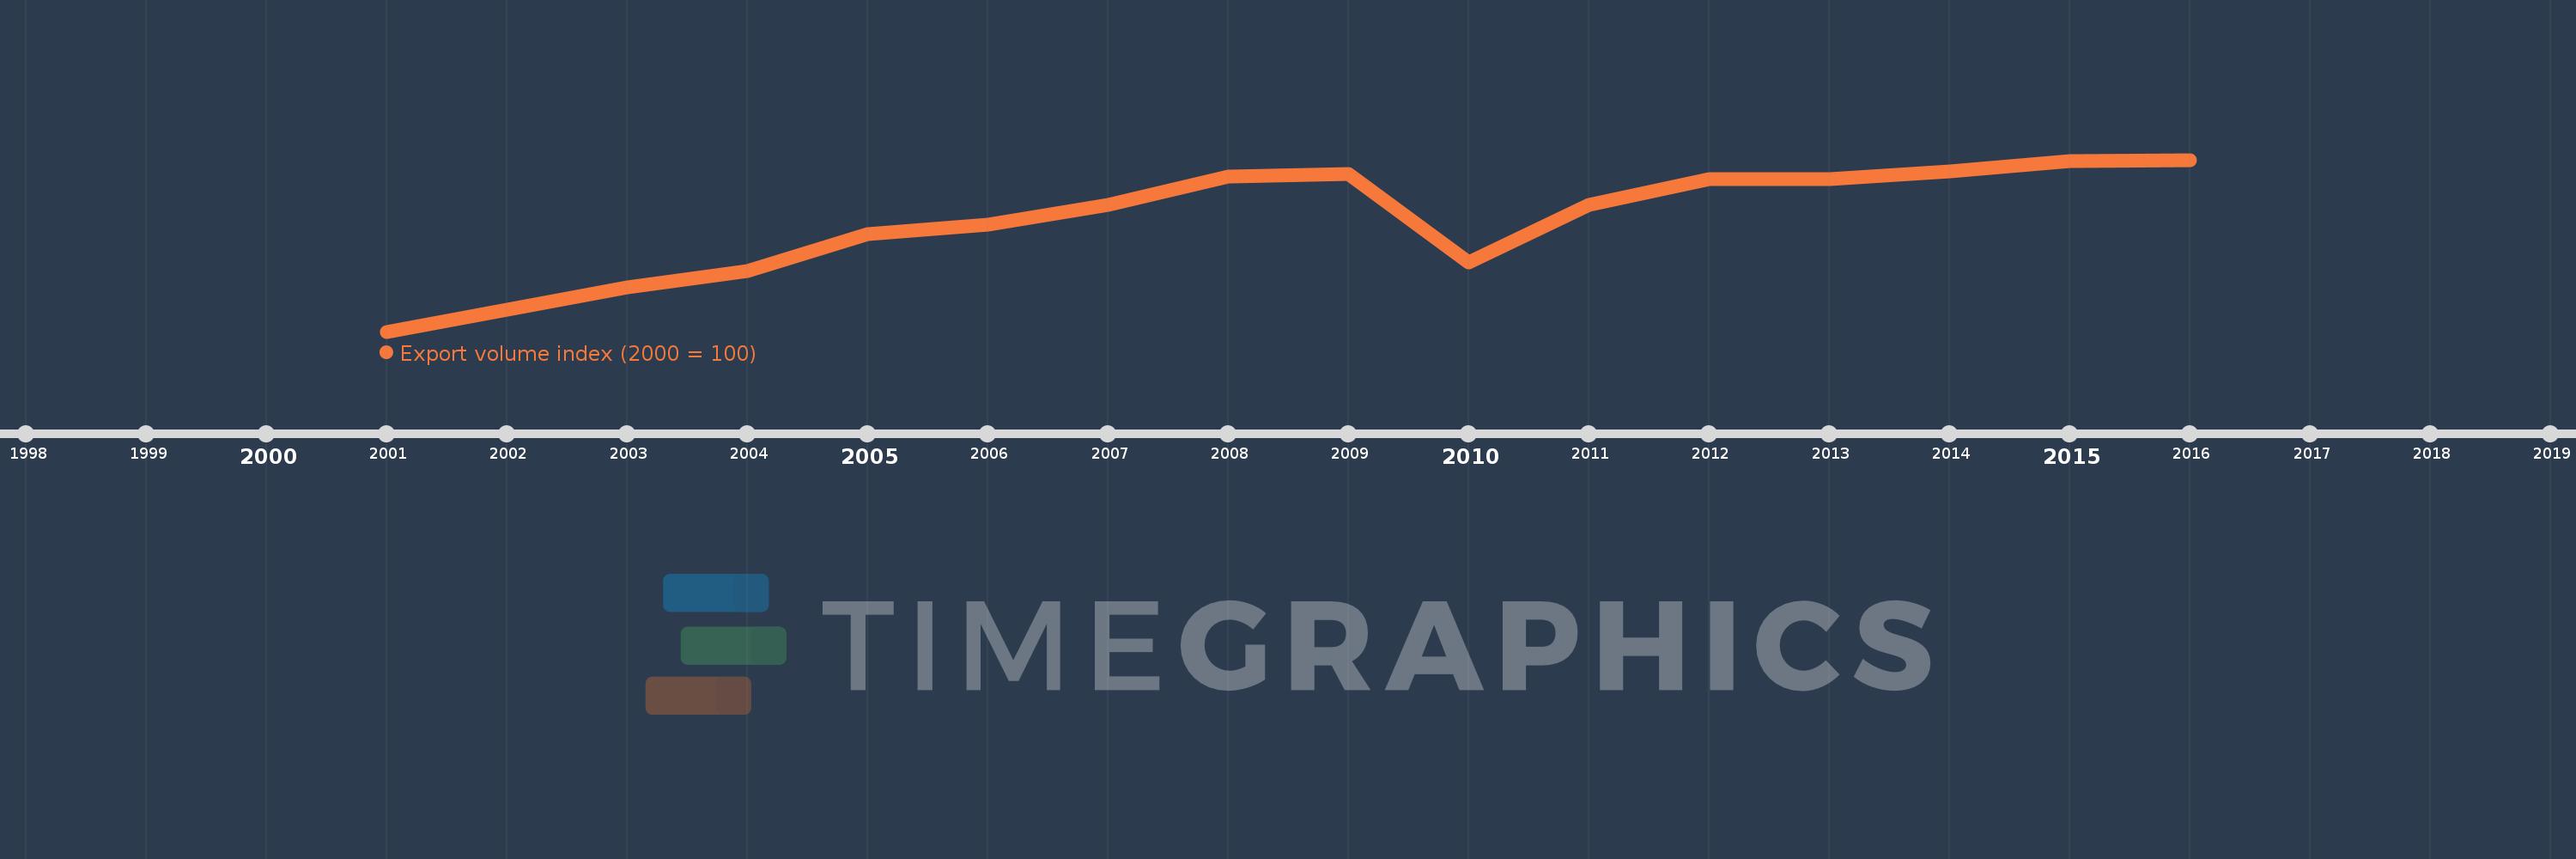
This timeline shows a graph from 2001 to 2016 of Austria. No data until 2000. Number of actual observations by date: 16.
Source name:
World Development Indicators
Source organization:
United Nations Conference on Trade and Development, Handbook of Statistics and data files, and International Monetary Fund, International Financial Statistics.
Categories, topics:
Private Sector, Trade
Last updated:
apr 23, 2017
Indicators value changes by year
Meaning:
133.732
Minimum:
100.0
jan 1, 2001
Maximum:
152.271
jan 1, 2016
At the date of observation
Value
Absolute change
Change from the previous value
jan 1, 2001
100.0
+100.0
0.0%
jan 1, 2002
106.638
+6.638
6.64%
jan 1, 2003
113.51
+6.873
6.44%
jan 1, 2004
118.486
+4.975
4.38%
jan 1, 2005
129.747
+11.262
9.5%
jan 1, 2006
132.639
+2.892
2.23%
jan 1, 2007
138.624
+5.985
4.51%
jan 1, 2008
147.195
+8.571
6.18%
jan 1, 2009
147.84
+0.645
0.44%
jan 1, 2010
120.92
-26.919
-18.21%
jan 1, 2011
138.426
+17.505
14.48%
jan 1, 2012
146.495
+8.069
5.83%
jan 1, 2013
146.319
-0.175
-0.12%
jan 1, 2014
148.716
+2.397
1.64%
jan 1, 2015
151.884
+3.168
2.13%
jan 1, 2016
152.271
+0.387
0.25%
Ranking of countries by current statistics by years
