30
/
AIzaSyAYiBZKx7MnpbEhh9jyipgxe19OcubqV5w
April 1, 2024
205199
Namibia
NAM
true
2
1
Export volume index (2000 = 100)
2016,2015,2014,2013,2012,2011,2010,2009,2008,2007,2006,2005,2004,2003,2002,2001,2000,1999,1998,1997,1996,1995,1994,1993,1992,1991
Download
Global statistics library →Namibia →

Export volume index (2000 = 100)

This statistics in other country:

AfghanistanAlbaniaAlgeriaAmerican SamoaAndorraAngolaAntigua and BarbudaArgentinaArmeniaArubaAustraliaAustriaAzerbaijanBahamas, TheBahrainBangladeshBarbadosBelarusBelgiumBelizeBeninBermudaBhutanBoliviaBosnia and HerzegovinaBotswanaBrazilBritish Virgin IslandsBrunei DarussalamBulgariaBurkina FasoBurundiCabo VerdeCambodiaCameroonCanadaCayman IslandsCentral African RepublicChadChileChinaColombiaComorosCongo, Dem. Rep.Congo, Rep.Costa RicaCote d'IvoireCroatiaCubaCuracaoCyprusCzech RepublicDenmarkDjiboutiDominicaDominican RepublicEcuadorEgypt, Arab Rep.El SalvadorEquatorial GuineaEritreaEstoniaEthiopiaFaroe IslandsFijiFinlandFranceFrench PolynesiaGabonGambia, TheGeorgiaGermanyGhanaGibraltarGreeceGreenlandGrenadaGuamGuatemalaGuineaGuinea-BissauGuyanaHaitiHondurasHong Kong SAR, ChinaHungaryIcelandIndiaIndonesiaIran, Islamic Rep.IraqIrelandIsraelItalyJamaicaJapanJordanKazakhstanKenyaKiribatiKorea, Dem. People’s Rep.Korea, Rep.KuwaitKyrgyz RepublicLao PDRLatviaLebanonLesothoLiberiaLibyaLithuaniaLuxembourgMacao SAR, ChinaMacedonia, FYRMadagascarMalawiMalaysiaMaldivesMaliMaltaMarshall IslandsMauritaniaMauritiusMexicoMicronesia, Fed. Sts.MoldovaMongoliaMoroccoMozambiqueMyanmarNamibiaNauruNepalNetherlandsNew CaledoniaNew ZealandNicaraguaNigerNigeriaNorthern Mariana IslandsNorwayOmanPakistanPalauPanamaPapua New GuineaParaguayPeruPhilippinesPolandPortugalQatarRomaniaRussian FederationRwandaSamoaSao Tome and PrincipeSaudi ArabiaSenegalSerbiaSeychellesSierra LeoneSingaporeSlovak RepublicSloveniaSolomon IslandsSomaliaSouth AfricaSpainSri LankaSt. Kitts and NevisSt. LuciaSt. Vincent and the GrenadinesSudanSurinameSwazilandSwedenSwitzerlandSyrian Arab RepublicTajikistanTanzaniaThailandTogoTongaTrinidad and TobagoTunisiaTurkeyTurkmenistanTurks and Caicos IslandsUgandaUkraineUnited Arab EmiratesUnited KingdomUnited StatesUruguayUzbekistanVanuatuVenezuela, RBVietnamWest Bank and GazaYemen, Rep.ZambiaZimbabwe

Timeline:

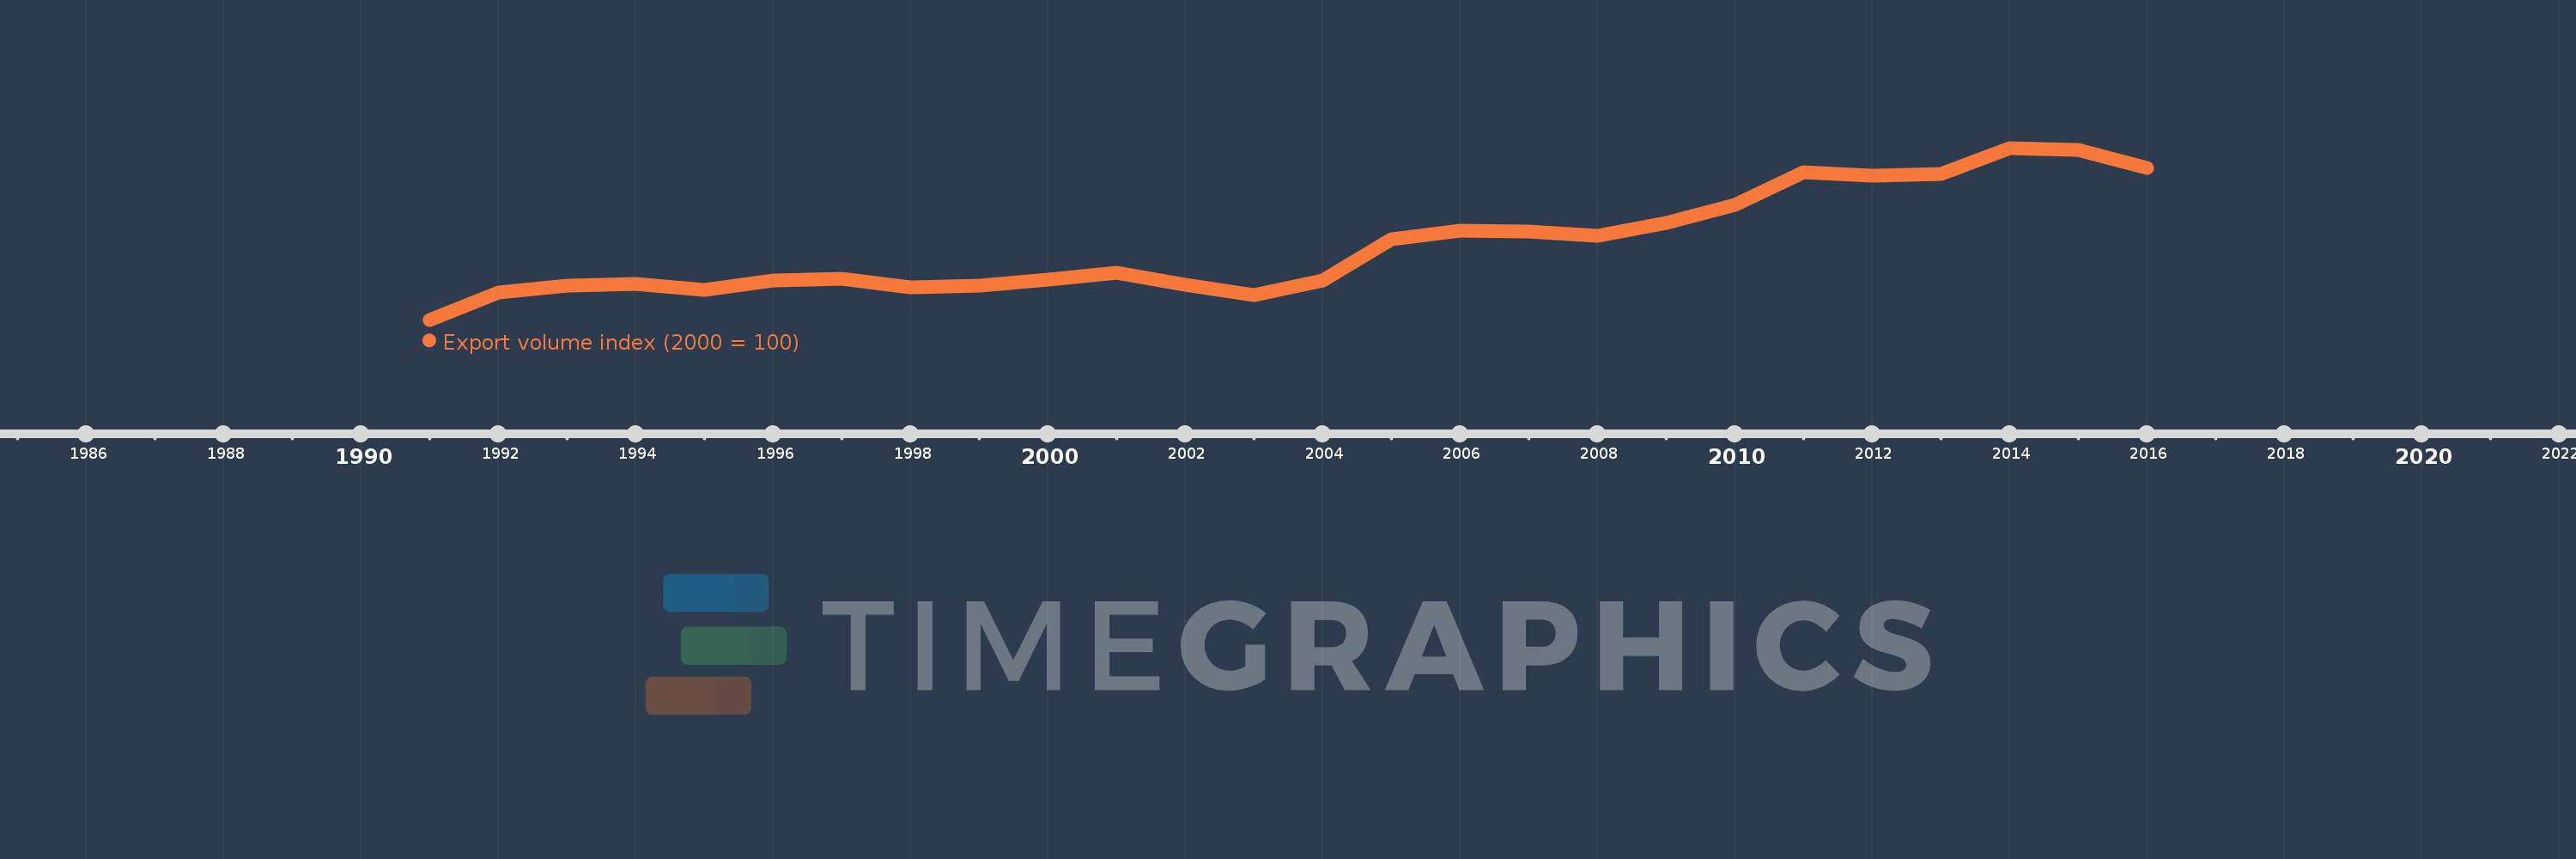
This timeline shows a graph from 1991 to 2016 of Namibia. No data until 1990. Number of actual observations by date: 26.

Source name:

World Development Indicators

Source organization:

United Nations Conference on Trade and Development, Handbook of Statistics and data files, and International Monetary Fund, International Financial Statistics.

Categories, topics:

Private Sector, Trade

Last updated:

apr 23, 2017

Indicators value changes by year

Meaning:
120.731
Minimum:
64.233
jan 1, 1991
Maximum:
194.086
jan 1, 2014
At the date of observation
Value
Absolute change
Change from the previous value
jan 1, 1991
64.233
+64.233
0.0%
jan 1, 1992
85.094
+20.861
32.48%
jan 1, 1993
89.904
+4.81
5.65%
jan 1, 1994
91.169
+1.265
1.41%
jan 1, 1995
86.919
-4.251
-4.66%
jan 1, 1996
93.626
+6.707
7.72%
jan 1, 1997
95.008
+1.382
1.48%
jan 1, 1998
88.905
-6.103
-6.42%
jan 1, 1999
89.726
+0.821
0.92%
jan 1, 2000
94.393
+4.667
5.2%
jan 1, 2001
100.0
+5.607
5.94%
jan 1, 2002
90.478
-9.522
-9.52%
jan 1, 2003
82.928
-7.55
-8.34%
jan 1, 2004
94.169
+11.241
13.55%
jan 1, 2005
125.145
+30.977
32.89%
jan 1, 2006
131.666
+6.521
5.21%
jan 1, 2007
130.708
-0.958
-0.73%
jan 1, 2008
127.658
-3.05
-2.33%
jan 1, 2009
137.524
+9.865
7.73%
jan 1, 2010
150.759
+13.236
9.62%
jan 1, 2011
175.985
+25.226
16.73%
jan 1, 2012
173.062
-2.923
-1.66%
jan 1, 2013
174.664
+1.601
0.93%
jan 1, 2014
194.086
+19.422
11.12%
jan 1, 2015
192.479
-1.607
-0.83%
jan 1, 2016
178.718
-13.761
-7.15%

Ranking of countries by current statistics by years