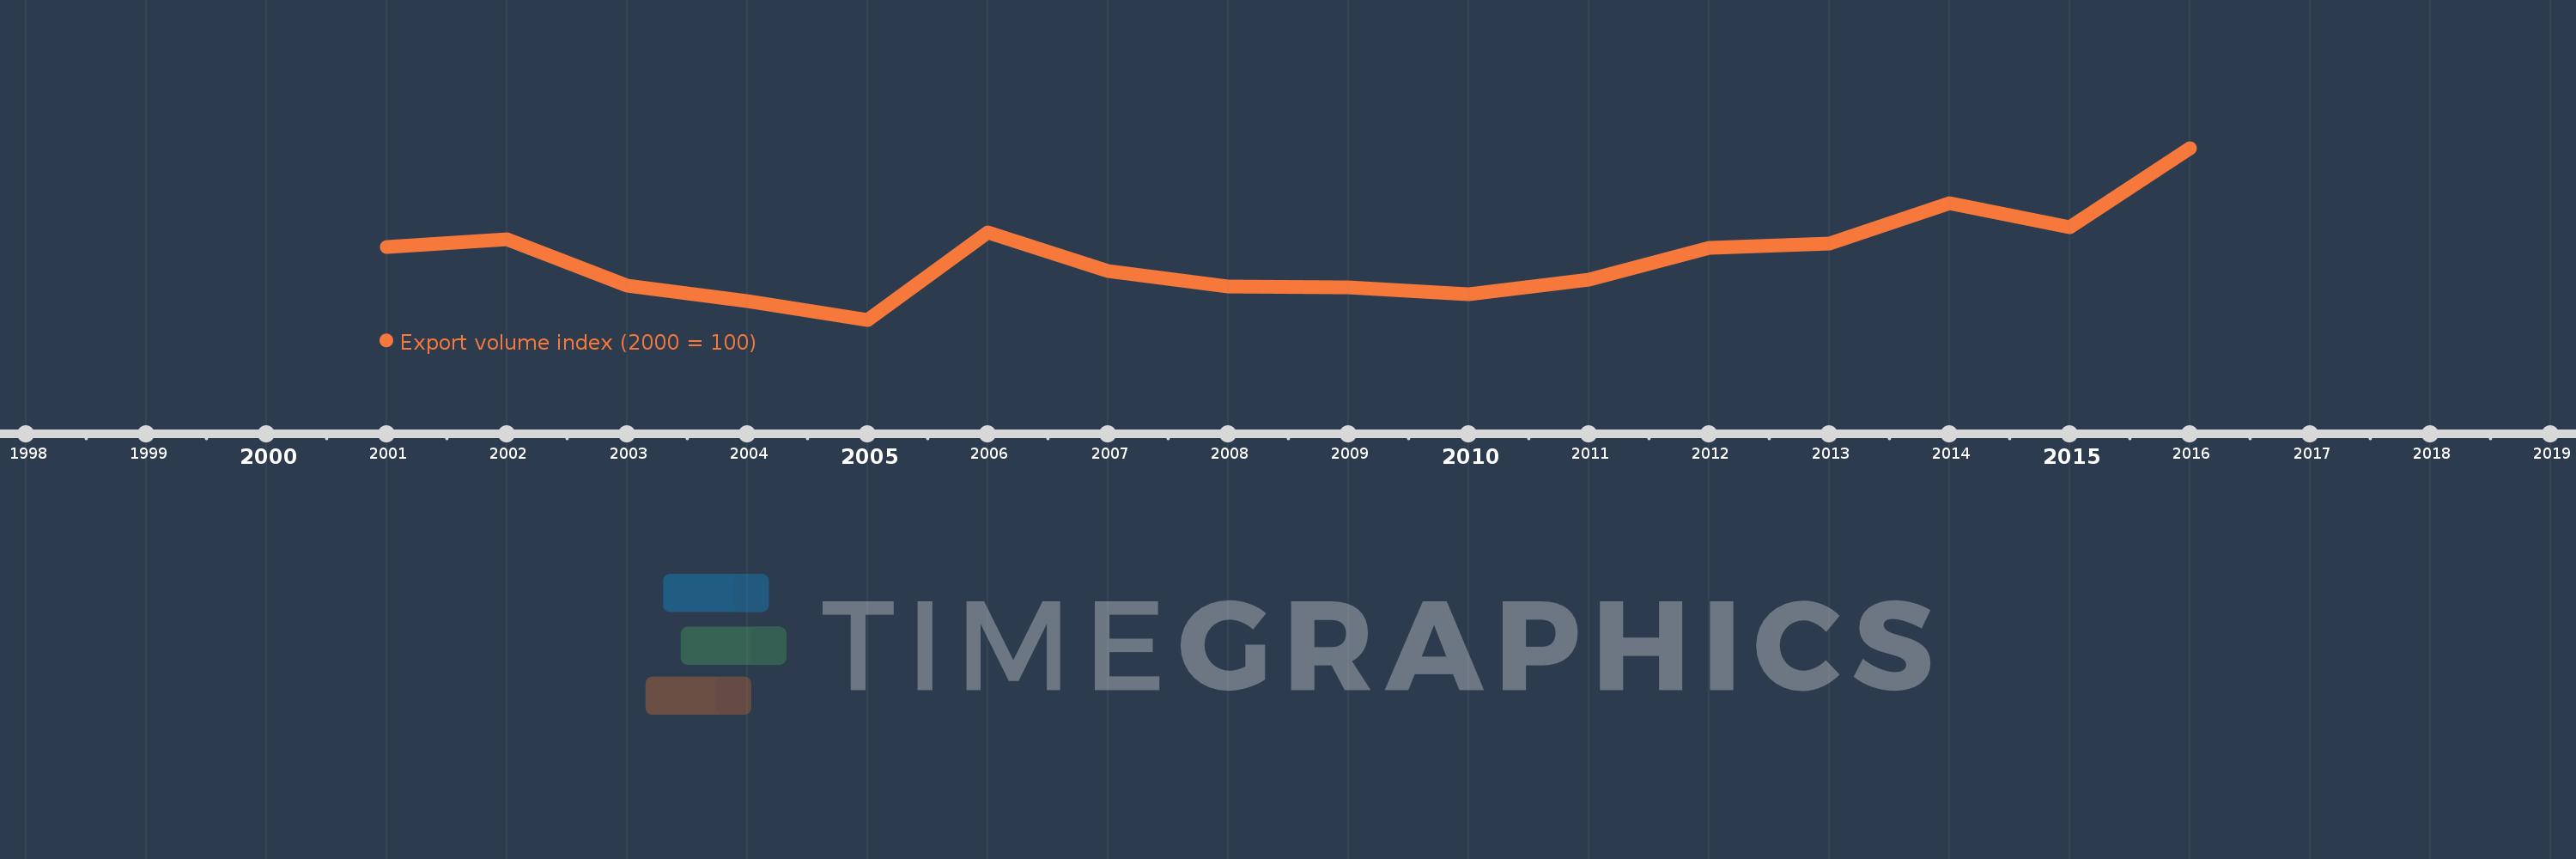
This timeline shows a graph from 2001 to 2016 of Cyprus. No data until 2000. Number of actual observations by date: 16.
Source name:
World Development Indicators
Source organization:
United Nations Conference on Trade and Development, Handbook of Statistics and data files, and International Monetary Fund, International Financial Statistics.
Categories, topics:
Private Sector, Trade
Last updated:
apr 23, 2017
Indicators value changes by year
Meaning:
95.785
Minimum:
70.595
jan 1, 2005
Maximum:
139.67
jan 1, 2016
At the date of observation
Value
Absolute change
Change from the previous value
jan 1, 2001
100.0
+100.0
0.0%
jan 1, 2002
102.866
+2.866
2.87%
jan 1, 2003
84.285
-18.581
-18.06%
jan 1, 2004
78.027
-6.258
-7.43%
jan 1, 2005
70.595
-7.431
-9.52%
jan 1, 2006
105.743
+35.148
49.79%
jan 1, 2007
90.079
-15.664
-14.81%
jan 1, 2008
83.907
-6.173
-6.85%
jan 1, 2009
83.463
-0.443
-0.53%
jan 1, 2010
80.898
-2.565
-3.07%
jan 1, 2011
86.868
+5.97
7.38%
jan 1, 2012
99.542
+12.674
14.59%
jan 1, 2013
101.086
+1.543
1.55%
jan 1, 2014
117.611
+16.526
16.35%
jan 1, 2015
107.926
-9.686
-8.24%
jan 1, 2016
139.67
+31.744
29.41%
Ranking of countries by current statistics by years
