29
/
en
AIzaSyAYiBZKx7MnpbEhh9jyipgxe19OcubqV5w
April 1, 2024
84824
Benin
BEN
true
2
1
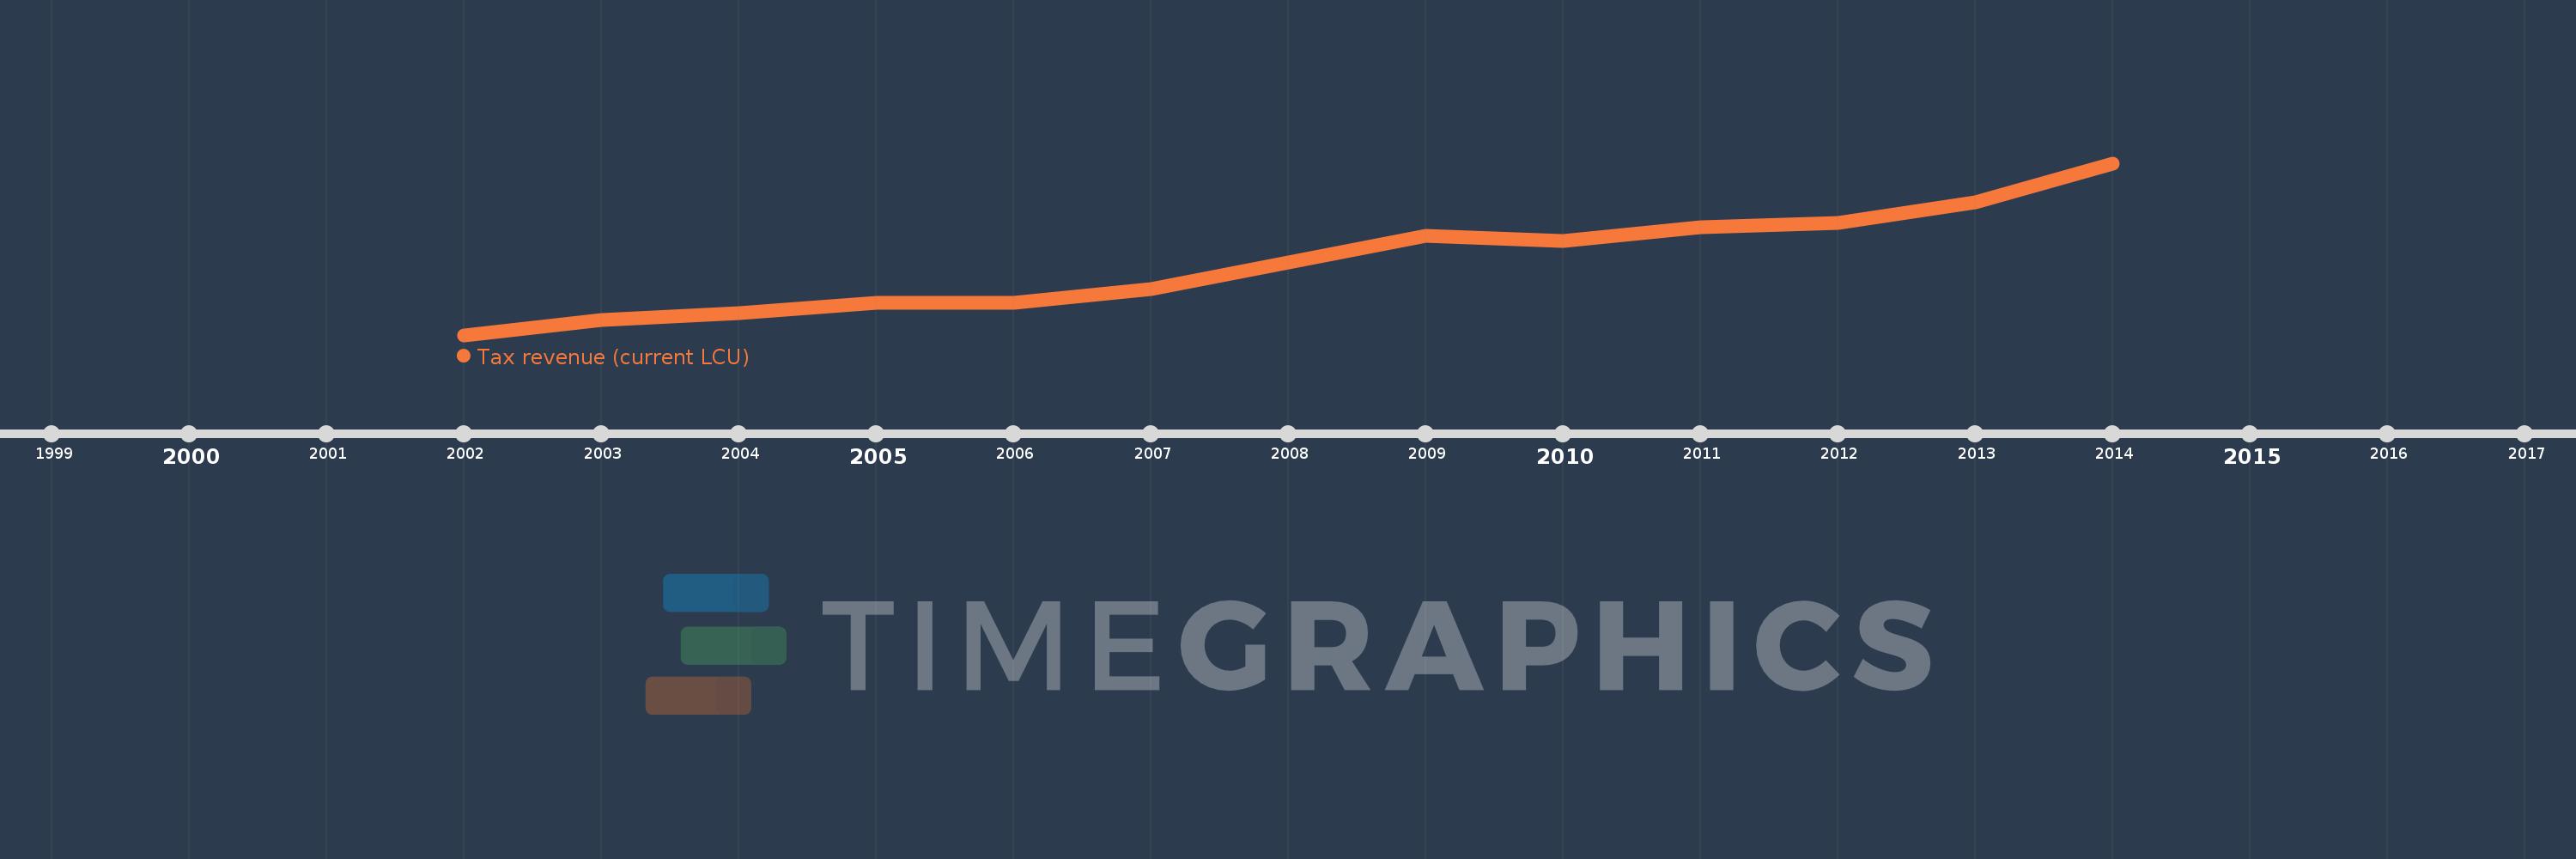
Tax revenue (current LCU)
2014,2013,2012,2011,2010,2009,2008,2007,2006,2005,2004,2003,2002
This statistics in other country:
AfghanistanAlbaniaAlgeriaAngolaAntigua and BarbudaArgentinaArmeniaAustraliaAustriaAzerbaijanBahamas, TheBahrainBangladeshBarbadosBelarusBelgiumBelizeBeninBhutanBoliviaBosnia and HerzegovinaBotswanaBrazilBulgariaBurkina FasoBurundiCabo VerdeCambodiaCanadaCentral African RepublicChileChinaColombiaCongo, Dem. Rep.Congo, Rep.Costa RicaCote d'IvoireCroatiaCyprusCzech RepublicDenmarkDominicaDominican RepublicEgypt, Arab Rep.El SalvadorEquatorial GuineaEstoniaEthiopiaFijiFinlandFranceGambia, TheGeorgiaGermanyGhanaGreeceGrenadaGuatemalaHondurasHong Kong SAR, ChinaHungaryIcelandIndiaIndonesiaIran, Islamic Rep.IraqIrelandIsraelItalyJamaicaJapanJordanKazakhstanKenyaKiribatiKorea, Rep.KuwaitKyrgyz RepublicLao PDRLatviaLebanonLesothoLiberiaLithuaniaLuxembourgMacao SAR, ChinaMacedonia, FYRMadagascarMalawiMalaysiaMaldivesMaliMaltaMauritiusMexicoMicronesia, Fed. Sts.MoldovaMongoliaMoroccoMozambiqueMyanmarNamibiaNepalNetherlandsNew ZealandNicaraguaNigeriaNorwayOmanPakistanPanamaPapua New GuineaParaguayPeruPhilippinesPolandPortugalQatarRomaniaRussian FederationRwandaSamoaSan MarinoSao Tome and PrincipeSenegalSerbiaSeychellesSierra LeoneSingaporeSlovak RepublicSloveniaSolomon IslandsSouth AfricaSpainSri LankaSt. Kitts and NevisSt. LuciaSt. Vincent and the GrenadinesSurinameSwazilandSwedenSwitzerlandSyrian Arab RepublicTajikistanTanzaniaThailandTimor-LesteTogoTrinidad and TobagoTunisiaTurkeyUgandaUkraineUnited Arab EmiratesUnited KingdomUnited StatesUruguayVanuatuVenezuela, RBVietnamWest Bank and GazaYemen, Rep.ZambiaZimbabwe Timeline:
This timeline shows a graph from 2002 to 2014 of Benin. No data until 2001. Number of actual observations by date: 13.
Source name:
World Development Indicators
Source organization:
International Monetary Fund, Government Finance Statistics Yearbook and data files.
Categories, topics:
Public Sector
Last updated:
apr 23, 2017
Indicators value changes by year
Minimum:
268.913 bln
jan 1, 2002
Maximum:
696.0 bln
jan 1, 2014
At the date of observation
Value
Absolute change
Change from previous value
jan 1, 2002
268.913 bln
+268.913 bln
0.0%
jan 1, 2003
306.843 bln
+37.93 bln
14.11%
jan 1, 2004
323.931 bln
+17.088 bln
5.57%
jan 1, 2005
349.593 bln
+25.662 bln
7.92%
jan 1, 2006
349.9 bln
+306.58 mln
0.09%
jan 1, 2007
382.177 bln
+32.277 bln
9.22%
jan 1, 2008
449.017 bln
+66.84 bln
17.49%
jan 1, 2009
514.751 bln
+65.734 bln
14.64%
jan 1, 2010
502.482 bln
-12.268 bln
-2.38%
jan 1, 2011
536.251 bln
+33.768 bln
6.72%
jan 1, 2012
546.564 bln
+10.313 bln
1.92%
jan 1, 2013
599.904 bln
+53.341 bln
9.76%
jan 1, 2014
696.0 bln
+96.096 bln
16.02%
Ranking of countries by current statistics by years


Comments: