29
/
en
AIzaSyAYiBZKx7MnpbEhh9jyipgxe19OcubqV5w
April 1, 2024
108048
Colombia
COL
true
2
1
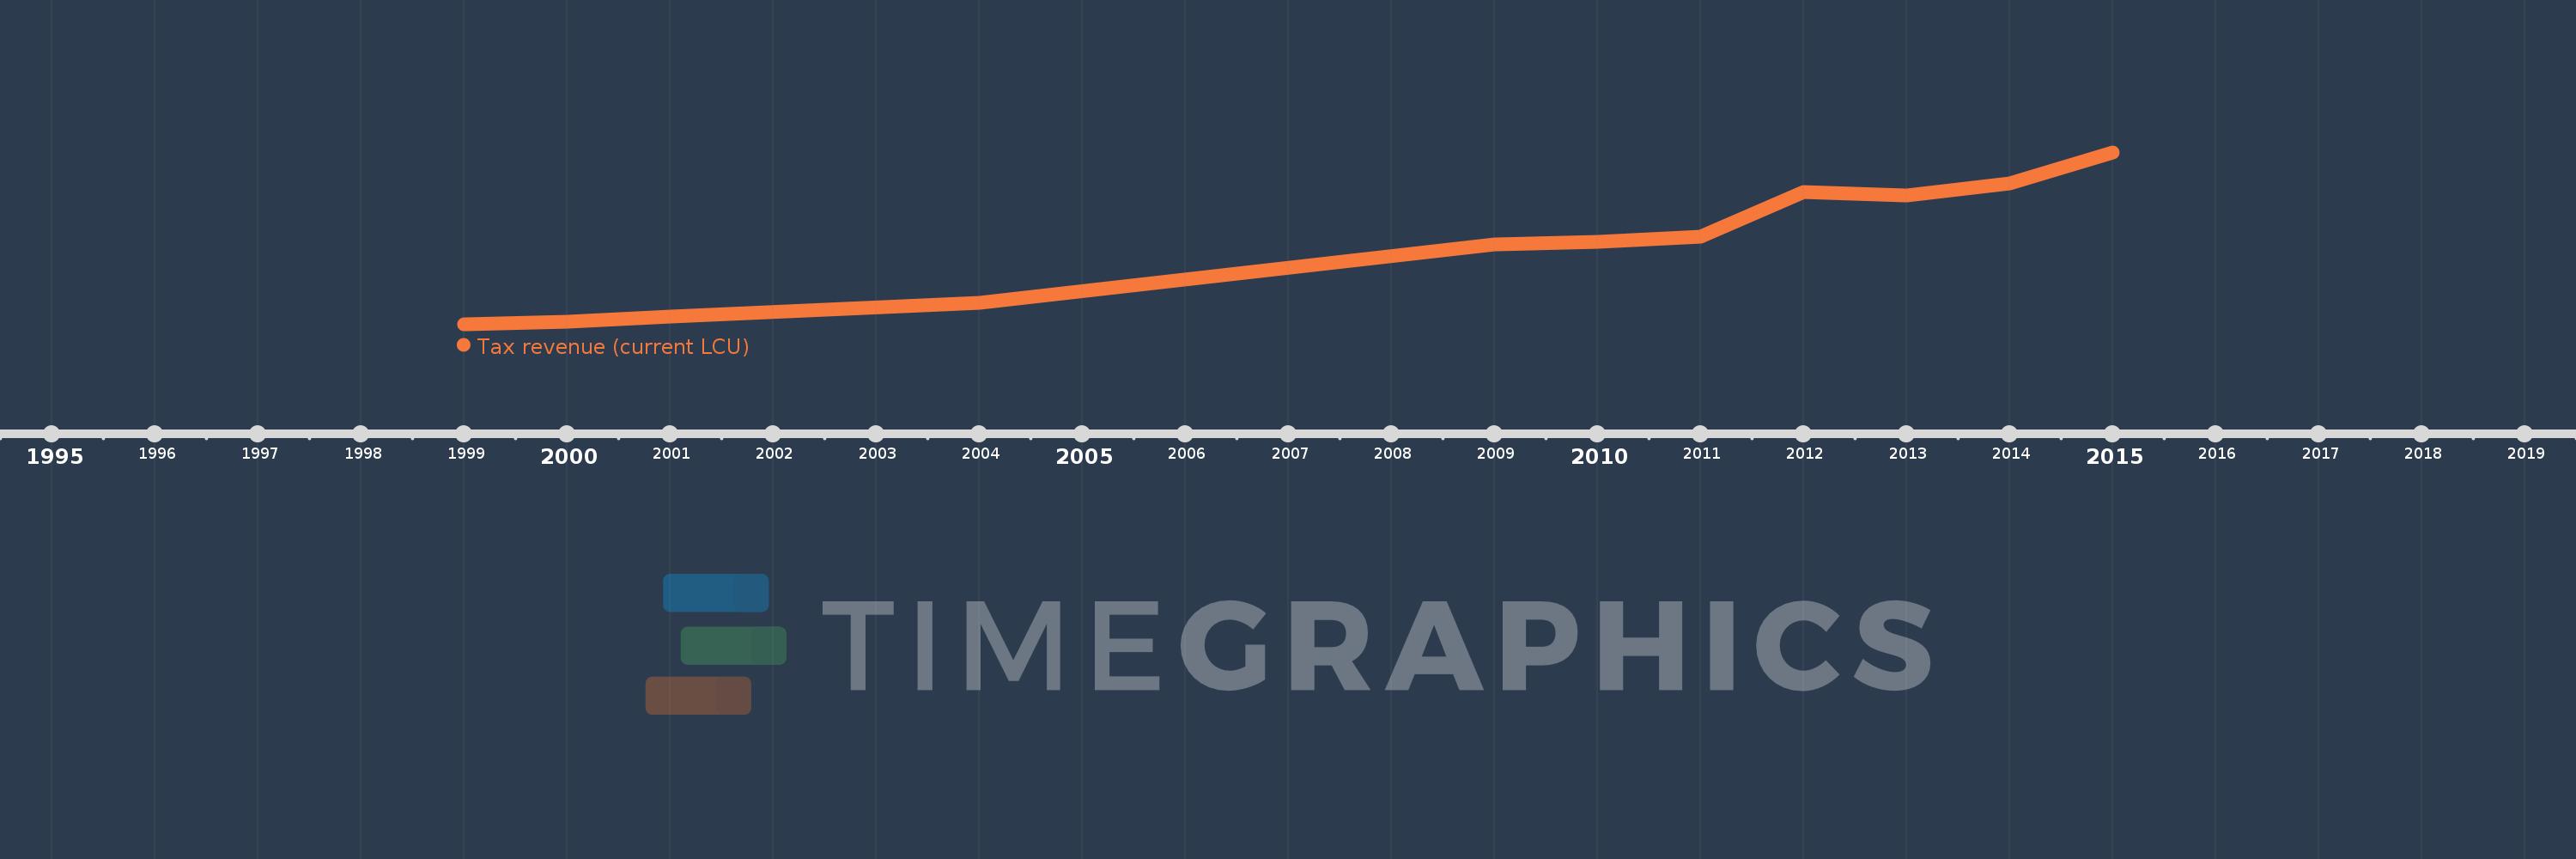
Tax revenue (current LCU)
2015,2014,2013,2012,2011,2010,2009,2004,2001,2000,1999
This statistics in other country:
AfghanistanAlbaniaAlgeriaAngolaAntigua and BarbudaArgentinaArmeniaAustraliaAustriaAzerbaijanBahamas, TheBahrainBangladeshBarbadosBelarusBelgiumBelizeBeninBhutanBoliviaBosnia and HerzegovinaBotswanaBrazilBulgariaBurkina FasoBurundiCabo VerdeCambodiaCanadaCentral African RepublicChileChinaColombiaCongo, Dem. Rep.Congo, Rep.Costa RicaCote d'IvoireCroatiaCyprusCzech RepublicDenmarkDominicaDominican RepublicEgypt, Arab Rep.El SalvadorEquatorial GuineaEstoniaEthiopiaFijiFinlandFranceGambia, TheGeorgiaGermanyGhanaGreeceGrenadaGuatemalaHondurasHong Kong SAR, ChinaHungaryIcelandIndiaIndonesiaIran, Islamic Rep.IraqIrelandIsraelItalyJamaicaJapanJordanKazakhstanKenyaKiribatiKorea, Rep.KuwaitKyrgyz RepublicLao PDRLatviaLebanonLesothoLiberiaLithuaniaLuxembourgMacao SAR, ChinaMacedonia, FYRMadagascarMalawiMalaysiaMaldivesMaliMaltaMauritiusMexicoMicronesia, Fed. Sts.MoldovaMongoliaMoroccoMozambiqueMyanmarNamibiaNepalNetherlandsNew ZealandNicaraguaNigeriaNorwayOmanPakistanPanamaPapua New GuineaParaguayPeruPhilippinesPolandPortugalQatarRomaniaRussian FederationRwandaSamoaSan MarinoSao Tome and PrincipeSenegalSerbiaSeychellesSierra LeoneSingaporeSlovak RepublicSloveniaSolomon IslandsSouth AfricaSpainSri LankaSt. Kitts and NevisSt. LuciaSt. Vincent and the GrenadinesSurinameSwazilandSwedenSwitzerlandSyrian Arab RepublicTajikistanTanzaniaThailandTimor-LesteTogoTrinidad and TobagoTunisiaTurkeyUgandaUkraineUnited Arab EmiratesUnited KingdomUnited StatesUruguayVanuatuVenezuela, RBVietnamWest Bank and GazaYemen, Rep.ZambiaZimbabwe Timeline:
This timeline shows a graph from 1999 to 2015 of Colombia. No data until 1998. Number of actual observations by date: 11.
Source name:
World Development Indicators
Source organization:
International Monetary Fund, Government Finance Statistics Yearbook and data files.
Categories, topics:
Public Sector
Last updated:
apr 23, 2017
Indicators value changes by year
Minimum:
19.308 trl
jan 1, 1999
Maximum:
111.303 trl
jan 1, 2015
At the date of observation
Value
Absolute change
Change from previous value
jan 1, 1999
19.308 trl
+19.308 trl
0.0%
jan 1, 2000
20.426 trl
+1.119 trl
5.79%
jan 1, 2001
23.397 trl
+2.97 trl
14.54%
jan 1, 2004
30.663 trl
+7.266 trl
31.06%
jan 1, 2009
62.102 trl
+31.439 trl
102.53%
jan 1, 2010
63.576 trl
+1.473 trl
2.37%
jan 1, 2011
66.061 trl
+2.485 trl
3.91%
jan 1, 2012
90.228 trl
+24.167 trl
36.58%
jan 1, 2013
88.159 trl
-2.069 trl
-2.29%
jan 1, 2014
94.854 trl
+6.695 trl
7.59%
jan 1, 2015
111.303 trl
+16.449 trl
17.34%
Ranking of countries by current statistics by years


Comments: