29
/
en
AIzaSyAYiBZKx7MnpbEhh9jyipgxe19OcubqV5w
April 1, 2024
267450
Trinidad and Tobago
TTO
true
2
1
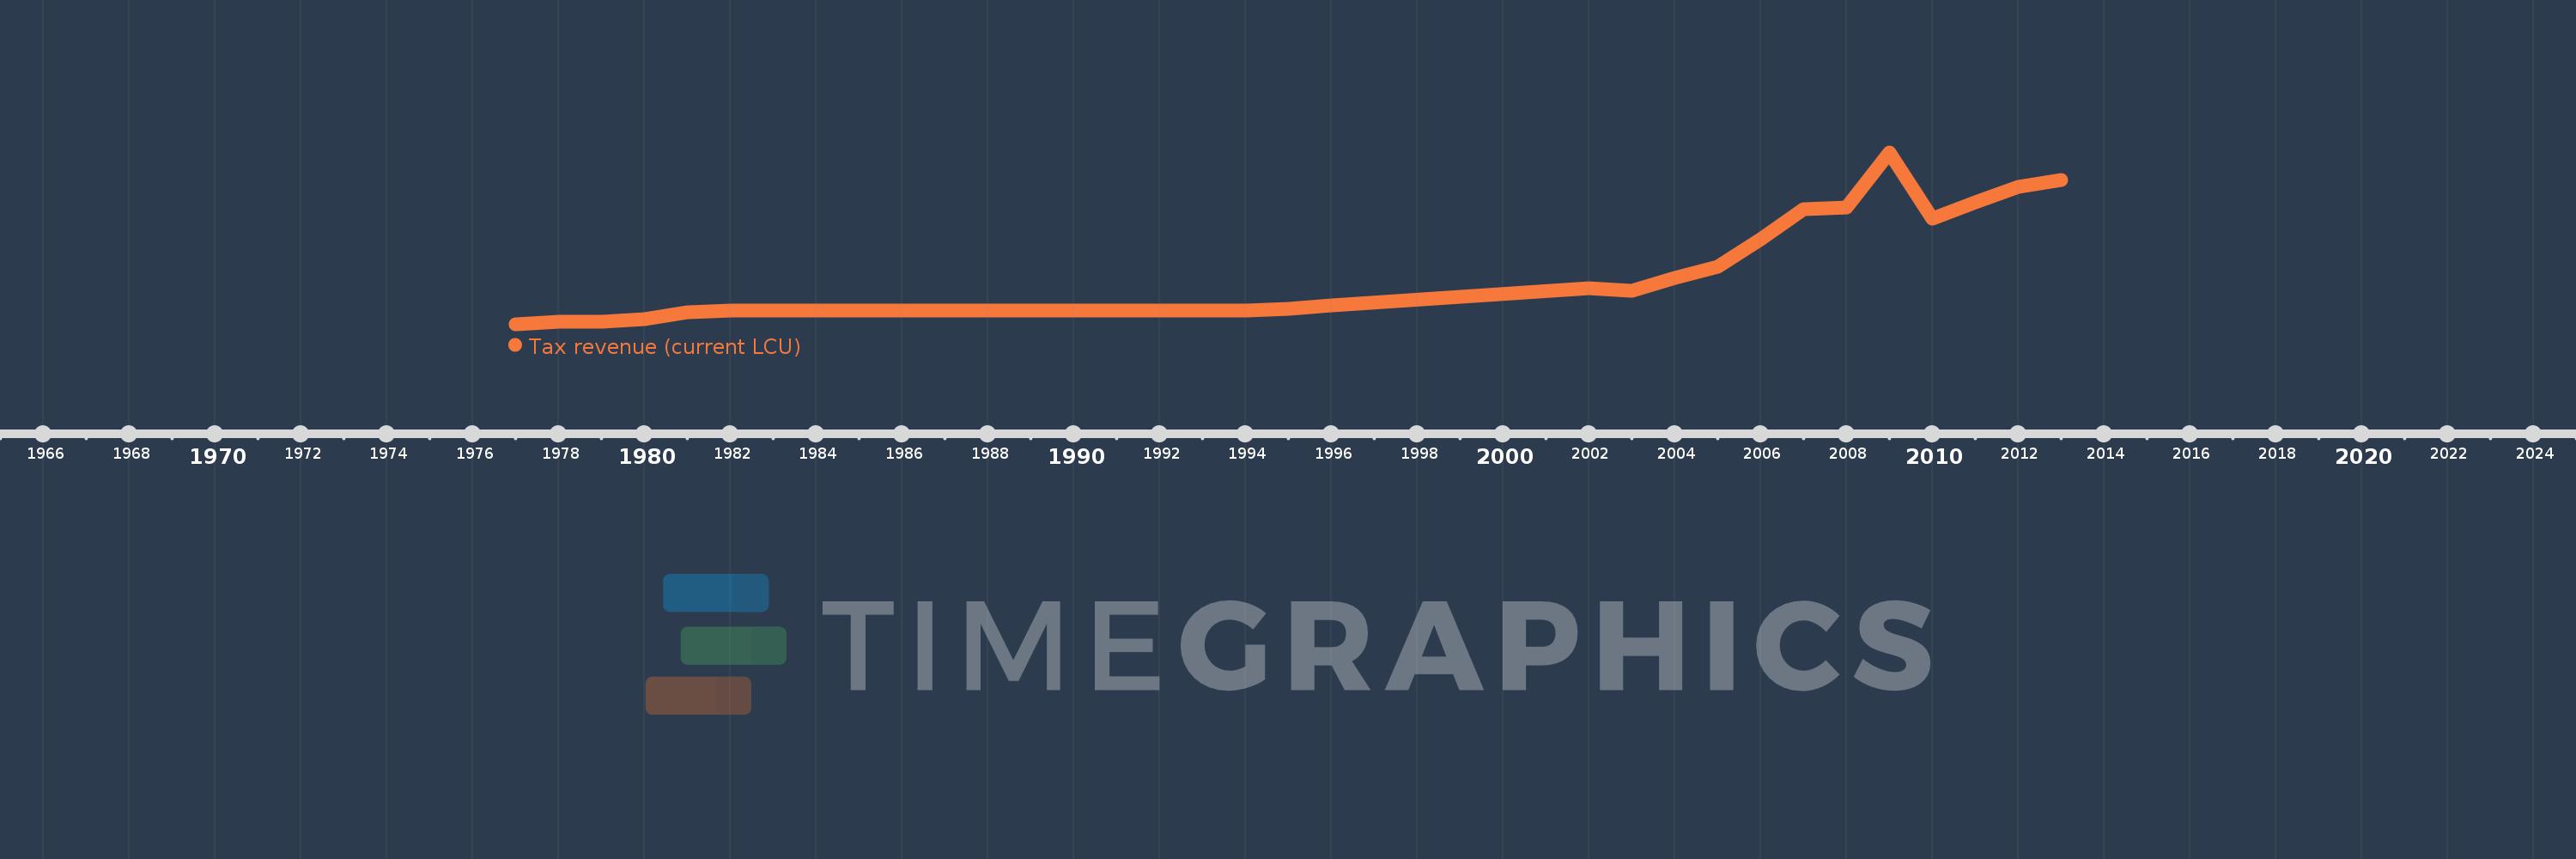
Tax revenue (current LCU)
2013,2012,2011,2010,2009,2008,2007,2006,2005,2004,2003,2002,1996,1995,1994,1982,1981,1980,1979,1978,1977
This statistics in other country:
AfghanistanAlbaniaAlgeriaAngolaAntigua and BarbudaArgentinaArmeniaAustraliaAustriaAzerbaijanBahamas, TheBahrainBangladeshBarbadosBelarusBelgiumBelizeBeninBhutanBoliviaBosnia and HerzegovinaBotswanaBrazilBulgariaBurkina FasoBurundiCabo VerdeCambodiaCanadaCentral African RepublicChileChinaColombiaCongo, Dem. Rep.Congo, Rep.Costa RicaCote d'IvoireCroatiaCyprusCzech RepublicDenmarkDominicaDominican RepublicEgypt, Arab Rep.El SalvadorEquatorial GuineaEstoniaEthiopiaFijiFinlandFranceGambia, TheGeorgiaGermanyGhanaGreeceGrenadaGuatemalaHondurasHong Kong SAR, ChinaHungaryIcelandIndiaIndonesiaIran, Islamic Rep.IraqIrelandIsraelItalyJamaicaJapanJordanKazakhstanKenyaKiribatiKorea, Rep.KuwaitKyrgyz RepublicLao PDRLatviaLebanonLesothoLiberiaLithuaniaLuxembourgMacao SAR, ChinaMacedonia, FYRMadagascarMalawiMalaysiaMaldivesMaliMaltaMauritiusMexicoMicronesia, Fed. Sts.MoldovaMongoliaMoroccoMozambiqueMyanmarNamibiaNepalNetherlandsNew ZealandNicaraguaNigeriaNorwayOmanPakistanPanamaPapua New GuineaParaguayPeruPhilippinesPolandPortugalQatarRomaniaRussian FederationRwandaSamoaSan MarinoSao Tome and PrincipeSenegalSerbiaSeychellesSierra LeoneSingaporeSlovak RepublicSloveniaSolomon IslandsSouth AfricaSpainSri LankaSt. Kitts and NevisSt. LuciaSt. Vincent and the GrenadinesSurinameSwazilandSwedenSwitzerlandSyrian Arab RepublicTajikistanTanzaniaThailandTimor-LesteTogoTrinidad and TobagoTunisiaTurkeyUgandaUkraineUnited Arab EmiratesUnited KingdomUnited StatesUruguayVanuatuVenezuela, RBVietnamWest Bank and GazaYemen, Rep.ZambiaZimbabwe Timeline:
This timeline shows a graph from 1977 to 2013 of Trinidad and Tobago. No data until 1976. Number of actual observations by date: 21.
Source name:
World Development Indicators
Source organization:
International Monetary Fund, Government Finance Statistics Yearbook and data files.
Categories, topics:
Public Sector
Last updated:
apr 23, 2017
Indicators value changes by year
Minimum:
1.802 bln
jan 1, 1977
Maximum:
51.689 bln
jan 1, 2009
At the date of observation
Value
Absolute change
Change from previous value
jan 1, 1977
1.802 bln
+1.802 bln
0.0%
jan 1, 1978
2.457 bln
+655.2 mln
36.36%
jan 1, 1979
2.458 bln
+700.0K
0.03%
jan 1, 1980
3.223 bln
+765.4 mln
31.14%
jan 1, 1981
5.335 bln
+2.112 bln
65.52%
jan 1, 1982
5.847 bln
+511.7 mln
9.59%
jan 1, 1994
5.697 bln
-149.9 mln
-2.56%
jan 1, 1995
6.269 bln
+571.5 mln
10.03%
jan 1, 1996
7.199 bln
+929.8 mln
14.83%
jan 1, 2002
12.168 bln
+4.97 bln
69.04%
jan 1, 2003
11.514 bln
-653.9 mln
-5.37%
jan 1, 2004
15.16 bln
+3.646 bln
31.66%
jan 1, 2005
18.424 bln
+3.264 bln
21.53%
jan 1, 2006
26.559 bln
+8.134 bln
44.15%
jan 1, 2007
35.084 bln
+8.525 bln
32.1%
jan 1, 2008
35.601 bln
+517.2 mln
1.47%
jan 1, 2009
51.689 bln
+16.088 bln
45.19%
jan 1, 2010
32.537 bln
-19.153 bln
-37.05%
jan 1, 2011
37.074 bln
+4.538 bln
13.95%
jan 1, 2012
41.801 bln
+4.727 bln
12.75%
jan 1, 2013
43.569 bln
+1.768 bln
4.23%
Ranking of countries by current statistics by years


Comments: