29
/
en
AIzaSyAYiBZKx7MnpbEhh9jyipgxe19OcubqV5w
April 1, 2024
211140
Nicaragua
NIC
true
2
1
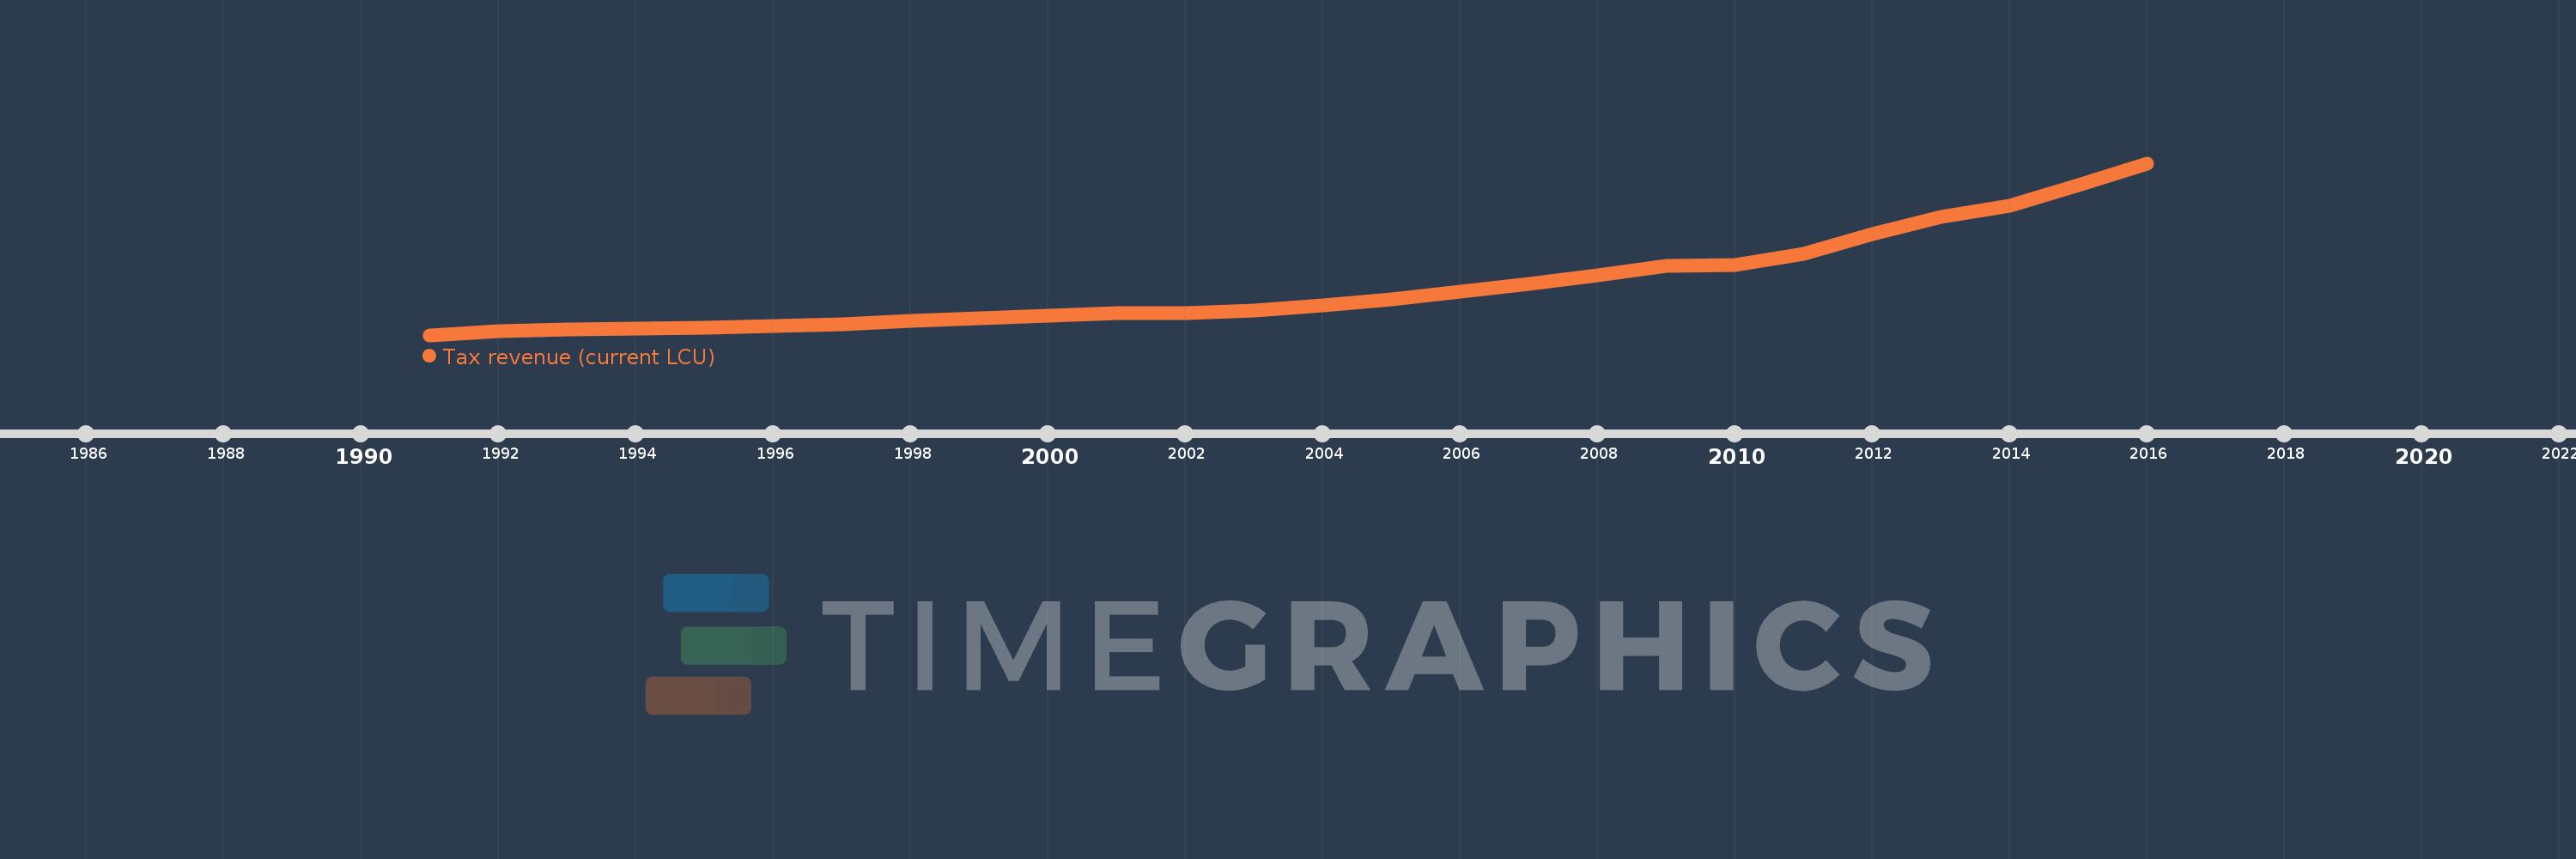
Tax revenue (current LCU)
2016,2015,2014,2013,2012,2011,2010,2009,2008,2007,2006,2005,2004,2003,2002,2001,2000,1999,1998,1997,1996,1995,1994,1993,1992,1991
This statistics in other country:
AfghanistanAlbaniaAlgeriaAngolaAntigua and BarbudaArgentinaArmeniaAustraliaAustriaAzerbaijanBahamas, TheBahrainBangladeshBarbadosBelarusBelgiumBelizeBeninBhutanBoliviaBosnia and HerzegovinaBotswanaBrazilBulgariaBurkina FasoBurundiCabo VerdeCambodiaCanadaCentral African RepublicChileChinaColombiaCongo, Dem. Rep.Congo, Rep.Costa RicaCote d'IvoireCroatiaCyprusCzech RepublicDenmarkDominicaDominican RepublicEgypt, Arab Rep.El SalvadorEquatorial GuineaEstoniaEthiopiaFijiFinlandFranceGambia, TheGeorgiaGermanyGhanaGreeceGrenadaGuatemalaHondurasHong Kong SAR, ChinaHungaryIcelandIndiaIndonesiaIran, Islamic Rep.IraqIrelandIsraelItalyJamaicaJapanJordanKazakhstanKenyaKiribatiKorea, Rep.KuwaitKyrgyz RepublicLao PDRLatviaLebanonLesothoLiberiaLithuaniaLuxembourgMacao SAR, ChinaMacedonia, FYRMadagascarMalawiMalaysiaMaldivesMaliMaltaMauritiusMexicoMicronesia, Fed. Sts.MoldovaMongoliaMoroccoMozambiqueMyanmarNamibiaNepalNetherlandsNew ZealandNicaraguaNigeriaNorwayOmanPakistanPanamaPapua New GuineaParaguayPeruPhilippinesPolandPortugalQatarRomaniaRussian FederationRwandaSamoaSan MarinoSao Tome and PrincipeSenegalSerbiaSeychellesSierra LeoneSingaporeSlovak RepublicSloveniaSolomon IslandsSouth AfricaSpainSri LankaSt. Kitts and NevisSt. LuciaSt. Vincent and the GrenadinesSurinameSwazilandSwedenSwitzerlandSyrian Arab RepublicTajikistanTanzaniaThailandTimor-LesteTogoTrinidad and TobagoTunisiaTurkeyUgandaUkraineUnited Arab EmiratesUnited KingdomUnited StatesUruguayVanuatuVenezuela, RBVietnamWest Bank and GazaYemen, Rep.ZambiaZimbabwe Timeline:
This timeline shows a graph from 1991 to 2016 of Nicaragua. No data until 1990. Number of actual observations by date: 26.
Source name:
World Development Indicators
Source organization:
International Monetary Fund, Government Finance Statistics Yearbook and data files.
Categories, topics:
Public Sector
Last updated:
apr 23, 2017
Indicators value changes by year
Minimum:
41.097 mln
jan 1, 1991
Maximum:
54.206 bln
jan 1, 2016
At the date of observation
Value
Absolute change
Change from previous value
jan 1, 1991
41.097 mln
+41.097 mln
0.0%
jan 1, 1992
1.317 bln
+1.276 bln
3.1K%
jan 1, 1993
1.779 bln
+462.3 mln
35.1%
jan 1, 1994
2.04 bln
+261.04 mln
14.67%
jan 1, 1995
2.335 bln
+294.46 mln
14.43%
jan 1, 1996
2.932 bln
+596.75 mln
25.56%
jan 1, 1997
3.45 bln
+518.81 mln
17.7%
jan 1, 1998
4.392 bln
+941.65 mln
27.29%
jan 1, 1999
5.413 bln
+1.021 bln
23.26%
jan 1, 2000
6.147 bln
+733.4 mln
13.55%
jan 1, 2001
6.9 bln
+753.56 mln
12.26%
jan 1, 2002
7.015 bln
+114.55 mln
1.66%
jan 1, 2003
7.739 bln
+723.933 mln
10.32%
jan 1, 2004
9.422 bln
+1.683 bln
21.75%
jan 1, 2005
11.253 bln
+1.83 bln
19.42%
jan 1, 2006
13.645 bln
+2.392 bln
21.26%
jan 1, 2007
16.262 bln
+2.617 bln
19.18%
jan 1, 2008
18.984 bln
+2.722 bln
16.74%
jan 1, 2009
21.73 bln
+2.746 bln
14.47%
jan 1, 2010
22.175 bln
+444.958 mln
2.05%
jan 1, 2011
25.586 bln
+3.411 bln
15.38%
jan 1, 2012
31.825 bln
+6.239 bln
24.38%
jan 1, 2013
37.222 bln
+5.397 bln
16.96%
jan 1, 2014
40.785 bln
+3.563 bln
9.57%
jan 1, 2015
47.236 bln
+6.451 bln
15.82%
jan 1, 2016
54.206 bln
+6.97 bln
14.76%
Ranking of countries by current statistics by years


Comments: