29
/
en
AIzaSyAYiBZKx7MnpbEhh9jyipgxe19OcubqV5w
April 1, 2024
173594
Kyrgyz Republic
KGZ
true
2
1
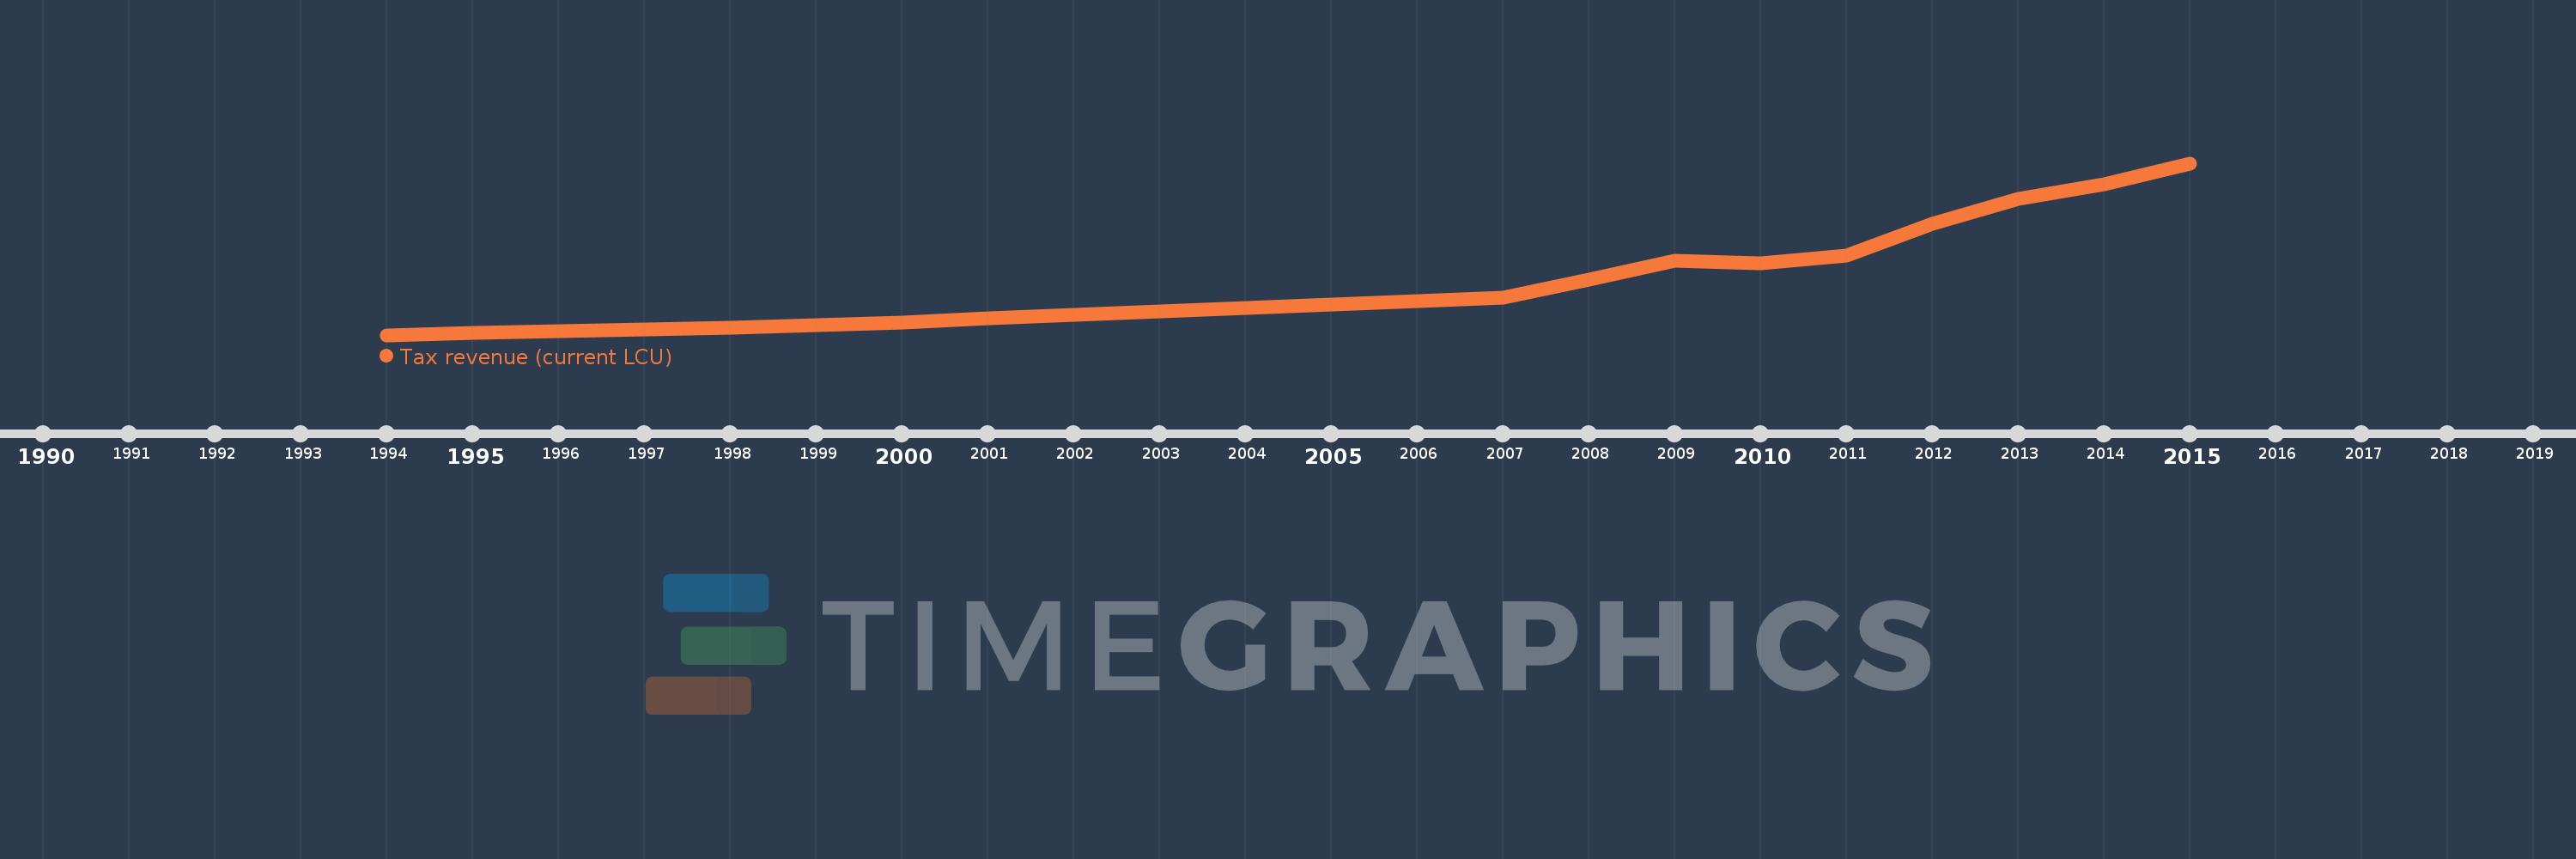
Tax revenue (current LCU)
2015,2014,2013,2012,2011,2010,2009,2008,2007,2002,2001,2000,1999,1998,1997,1996,1995,1994
This statistics in other country:
AfghanistanAlbaniaAlgeriaAngolaAntigua and BarbudaArgentinaArmeniaAustraliaAustriaAzerbaijanBahamas, TheBahrainBangladeshBarbadosBelarusBelgiumBelizeBeninBhutanBoliviaBosnia and HerzegovinaBotswanaBrazilBulgariaBurkina FasoBurundiCabo VerdeCambodiaCanadaCentral African RepublicChileChinaColombiaCongo, Dem. Rep.Congo, Rep.Costa RicaCote d'IvoireCroatiaCyprusCzech RepublicDenmarkDominicaDominican RepublicEgypt, Arab Rep.El SalvadorEquatorial GuineaEstoniaEthiopiaFijiFinlandFranceGambia, TheGeorgiaGermanyGhanaGreeceGrenadaGuatemalaHondurasHong Kong SAR, ChinaHungaryIcelandIndiaIndonesiaIran, Islamic Rep.IraqIrelandIsraelItalyJamaicaJapanJordanKazakhstanKenyaKiribatiKorea, Rep.KuwaitKyrgyz RepublicLao PDRLatviaLebanonLesothoLiberiaLithuaniaLuxembourgMacao SAR, ChinaMacedonia, FYRMadagascarMalawiMalaysiaMaldivesMaliMaltaMauritiusMexicoMicronesia, Fed. Sts.MoldovaMongoliaMoroccoMozambiqueMyanmarNamibiaNepalNetherlandsNew ZealandNicaraguaNigeriaNorwayOmanPakistanPanamaPapua New GuineaParaguayPeruPhilippinesPolandPortugalQatarRomaniaRussian FederationRwandaSamoaSan MarinoSao Tome and PrincipeSenegalSerbiaSeychellesSierra LeoneSingaporeSlovak RepublicSloveniaSolomon IslandsSouth AfricaSpainSri LankaSt. Kitts and NevisSt. LuciaSt. Vincent and the GrenadinesSurinameSwazilandSwedenSwitzerlandSyrian Arab RepublicTajikistanTanzaniaThailandTimor-LesteTogoTrinidad and TobagoTunisiaTurkeyUgandaUkraineUnited Arab EmiratesUnited KingdomUnited StatesUruguayVanuatuVenezuela, RBVietnamWest Bank and GazaYemen, Rep.ZambiaZimbabwe Timeline:
This timeline shows a graph from 1994 to 2015 of Kyrgyz Republic. No data until 1993. Number of actual observations by date: 18.
Source name:
World Development Indicators
Source organization:
International Monetary Fund, Government Finance Statistics Yearbook and data files.
Categories, topics:
Public Sector
Last updated:
apr 23, 2017
Indicators value changes by year
Minimum:
795.7 mln
jan 1, 1994
Maximum:
70.945 bln
jan 1, 2015
At the date of observation
Value
Absolute change
Change from previous value
jan 1, 1994
795.7 mln
+795.7 mln
0.0%
jan 1, 1995
1.764 bln
+968.2 mln
121.68%
jan 1, 1996
2.432 bln
+668.2 mln
37.88%
jan 1, 1997
2.947 bln
+514.92 mln
21.17%
jan 1, 1998
3.839 bln
+892.19 mln
30.27%
jan 1, 1999
4.865 bln
+1.026 bln
26.72%
jan 1, 2000
5.954 bln
+1.089 bln
22.38%
jan 1, 2001
7.676 bln
+1.722 bln
28.91%
jan 1, 2002
9.188 bln
+1.512 bln
19.7%
jan 1, 2007
16.18 bln
+6.993 bln
76.11%
jan 1, 2008
23.266 bln
+7.086 bln
43.79%
jan 1, 2009
31.035 bln
+7.769 bln
33.39%
jan 1, 2010
30.256 bln
-778.597 mln
-2.51%
jan 1, 2011
33.122 bln
+2.866 bln
9.47%
jan 1, 2012
46.125 bln
+13.003 bln
39.26%
jan 1, 2013
56.247 bln
+10.122 bln
21.94%
jan 1, 2014
62.414 bln
+6.167 bln
10.96%
jan 1, 2015
70.945 bln
+8.531 bln
13.67%
Ranking of countries by current statistics by years


Comments: