29
/
en
AIzaSyAYiBZKx7MnpbEhh9jyipgxe19OcubqV5w
April 1, 2024
166909
Kazakhstan
KAZ
true
2
1
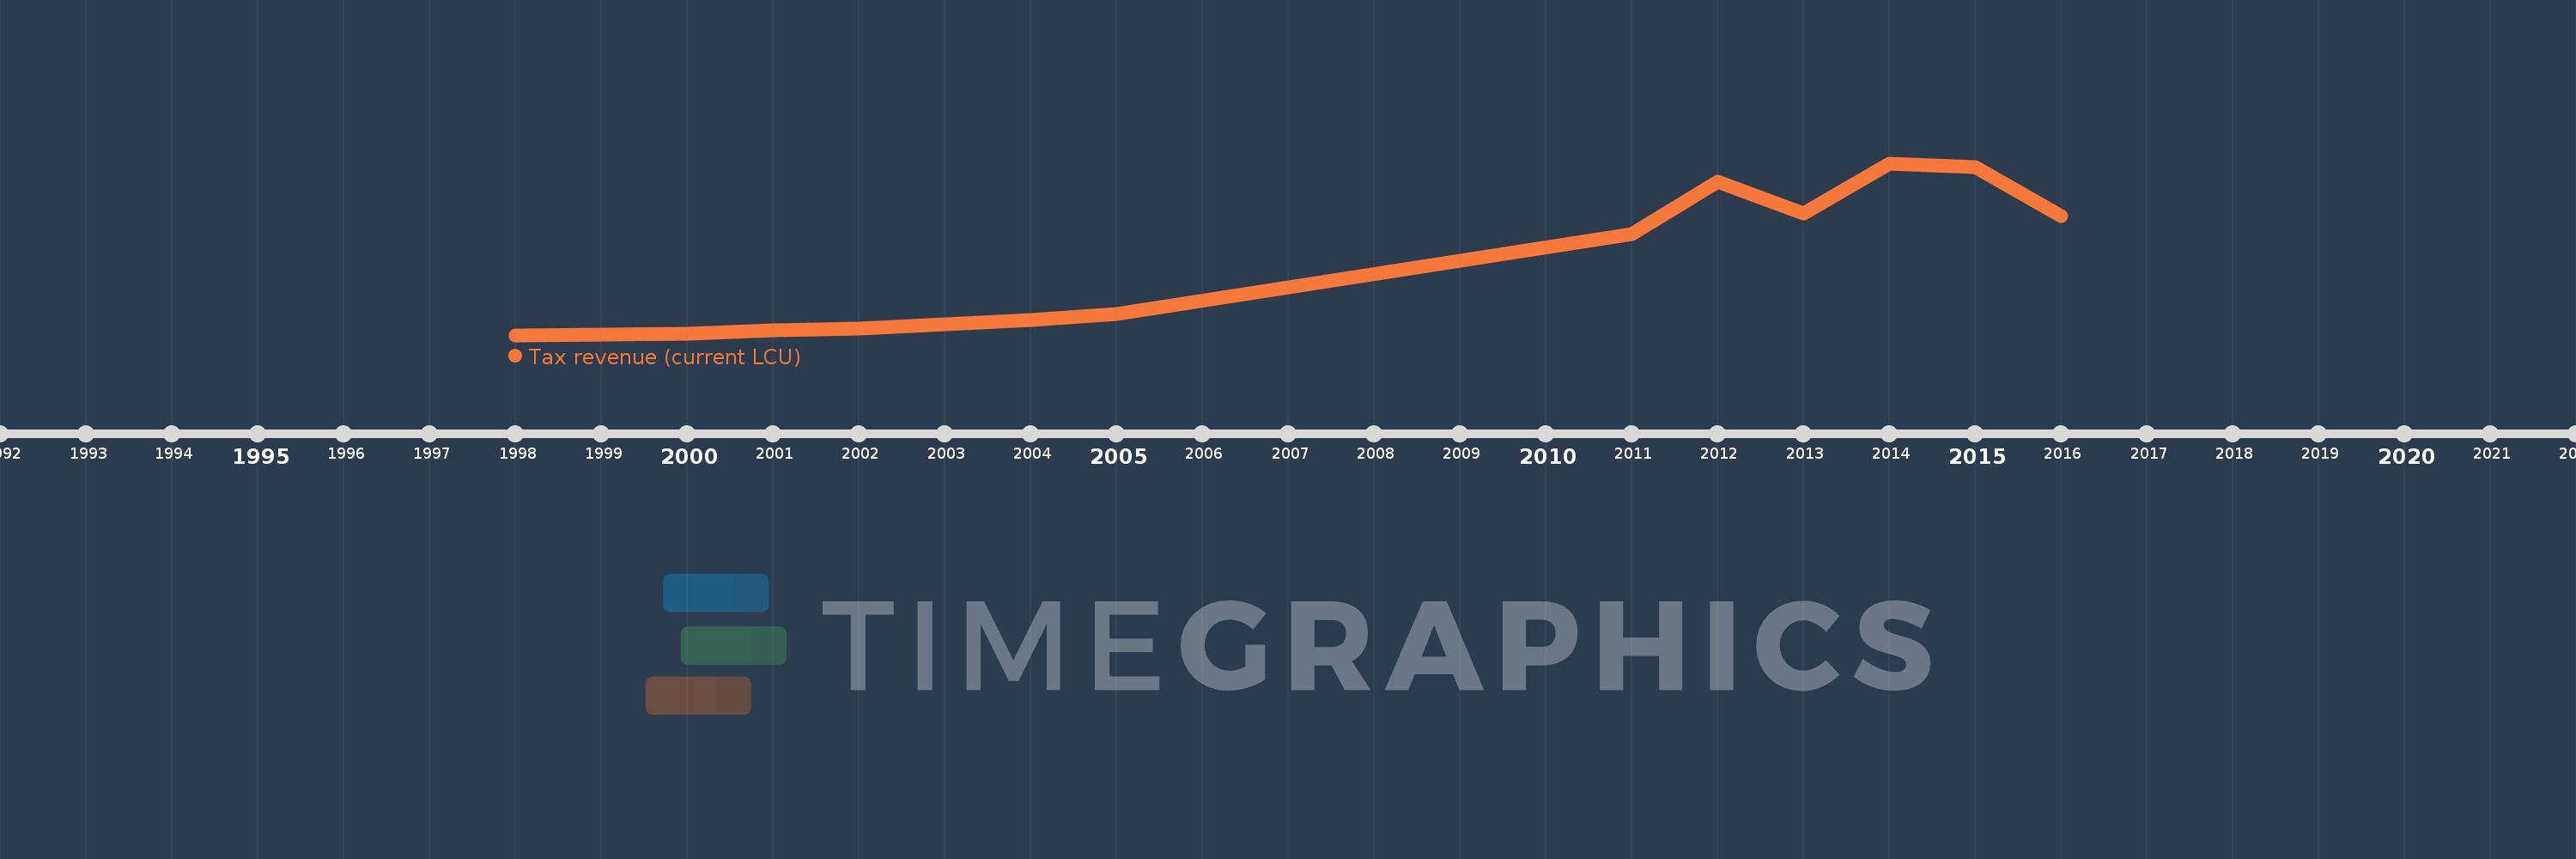
Tax revenue (current LCU)
2016,2015,2014,2013,2012,2011,2005,2004,2003,2002,2001,2000,1999,1998
This statistics in other country:
AfghanistanAlbaniaAlgeriaAngolaAntigua and BarbudaArgentinaArmeniaAustraliaAustriaAzerbaijanBahamas, TheBahrainBangladeshBarbadosBelarusBelgiumBelizeBeninBhutanBoliviaBosnia and HerzegovinaBotswanaBrazilBulgariaBurkina FasoBurundiCabo VerdeCambodiaCanadaCentral African RepublicChileChinaColombiaCongo, Dem. Rep.Congo, Rep.Costa RicaCote d'IvoireCroatiaCyprusCzech RepublicDenmarkDominicaDominican RepublicEgypt, Arab Rep.El SalvadorEquatorial GuineaEstoniaEthiopiaFijiFinlandFranceGambia, TheGeorgiaGermanyGhanaGreeceGrenadaGuatemalaHondurasHong Kong SAR, ChinaHungaryIcelandIndiaIndonesiaIran, Islamic Rep.IraqIrelandIsraelItalyJamaicaJapanJordanKazakhstanKenyaKiribatiKorea, Rep.KuwaitKyrgyz RepublicLao PDRLatviaLebanonLesothoLiberiaLithuaniaLuxembourgMacao SAR, ChinaMacedonia, FYRMadagascarMalawiMalaysiaMaldivesMaliMaltaMauritiusMexicoMicronesia, Fed. Sts.MoldovaMongoliaMoroccoMozambiqueMyanmarNamibiaNepalNetherlandsNew ZealandNicaraguaNigeriaNorwayOmanPakistanPanamaPapua New GuineaParaguayPeruPhilippinesPolandPortugalQatarRomaniaRussian FederationRwandaSamoaSan MarinoSao Tome and PrincipeSenegalSerbiaSeychellesSierra LeoneSingaporeSlovak RepublicSloveniaSolomon IslandsSouth AfricaSpainSri LankaSt. Kitts and NevisSt. LuciaSt. Vincent and the GrenadinesSurinameSwazilandSwedenSwitzerlandSyrian Arab RepublicTajikistanTanzaniaThailandTimor-LesteTogoTrinidad and TobagoTunisiaTurkeyUgandaUkraineUnited Arab EmiratesUnited KingdomUnited StatesUruguayVanuatuVenezuela, RBVietnamWest Bank and GazaYemen, Rep.ZambiaZimbabwe Timeline:
This timeline shows a graph from 1998 to 2016 of Kazakhstan. No data until 1997. Number of actual observations by date: 14.
Source name:
World Development Indicators
Source organization:
International Monetary Fund, Government Finance Statistics Yearbook and data files.
Categories, topics:
Public Sector
Last updated:
apr 23, 2017
Indicators value changes by year
Minimum:
113.492 bln
jan 1, 1998
Maximum:
5.771 trl
jan 1, 2014
At the date of observation
Value
Absolute change
Change from previous value
jan 1, 1998
113.492 bln
+113.492 bln
0.0%
jan 1, 1999
126.438 bln
+12.946 bln
11.41%
jan 1, 2000
156.182 bln
+29.744 bln
23.52%
jan 1, 2001
265.746 bln
+109.564 bln
70.15%
jan 1, 2002
313.432 bln
+47.686 bln
17.94%
jan 1, 2003
458.227 bln
+144.795 bln
46.2%
jan 1, 2004
603.396 bln
+145.169 bln
31.68%
jan 1, 2005
816.458 bln
+213.062 bln
35.31%
jan 1, 2011
3.428 trl
+2.611 trl
319.83%
jan 1, 2012
5.157 trl
+1.729 trl
50.44%
jan 1, 2013
4.129 trl
-1.028 trl
-19.93%
jan 1, 2014
5.771 trl
+1.642 trl
39.77%
jan 1, 2015
5.631 trl
-139.345 bln
-2.41%
jan 1, 2016
4.021 trl
-1.61 trl
-28.59%
Ranking of countries by current statistics by years


Comments: