29
/
en
AIzaSyAYiBZKx7MnpbEhh9jyipgxe19OcubqV5w
April 1, 2024
204776
Myanmar
MMR
true
2
1
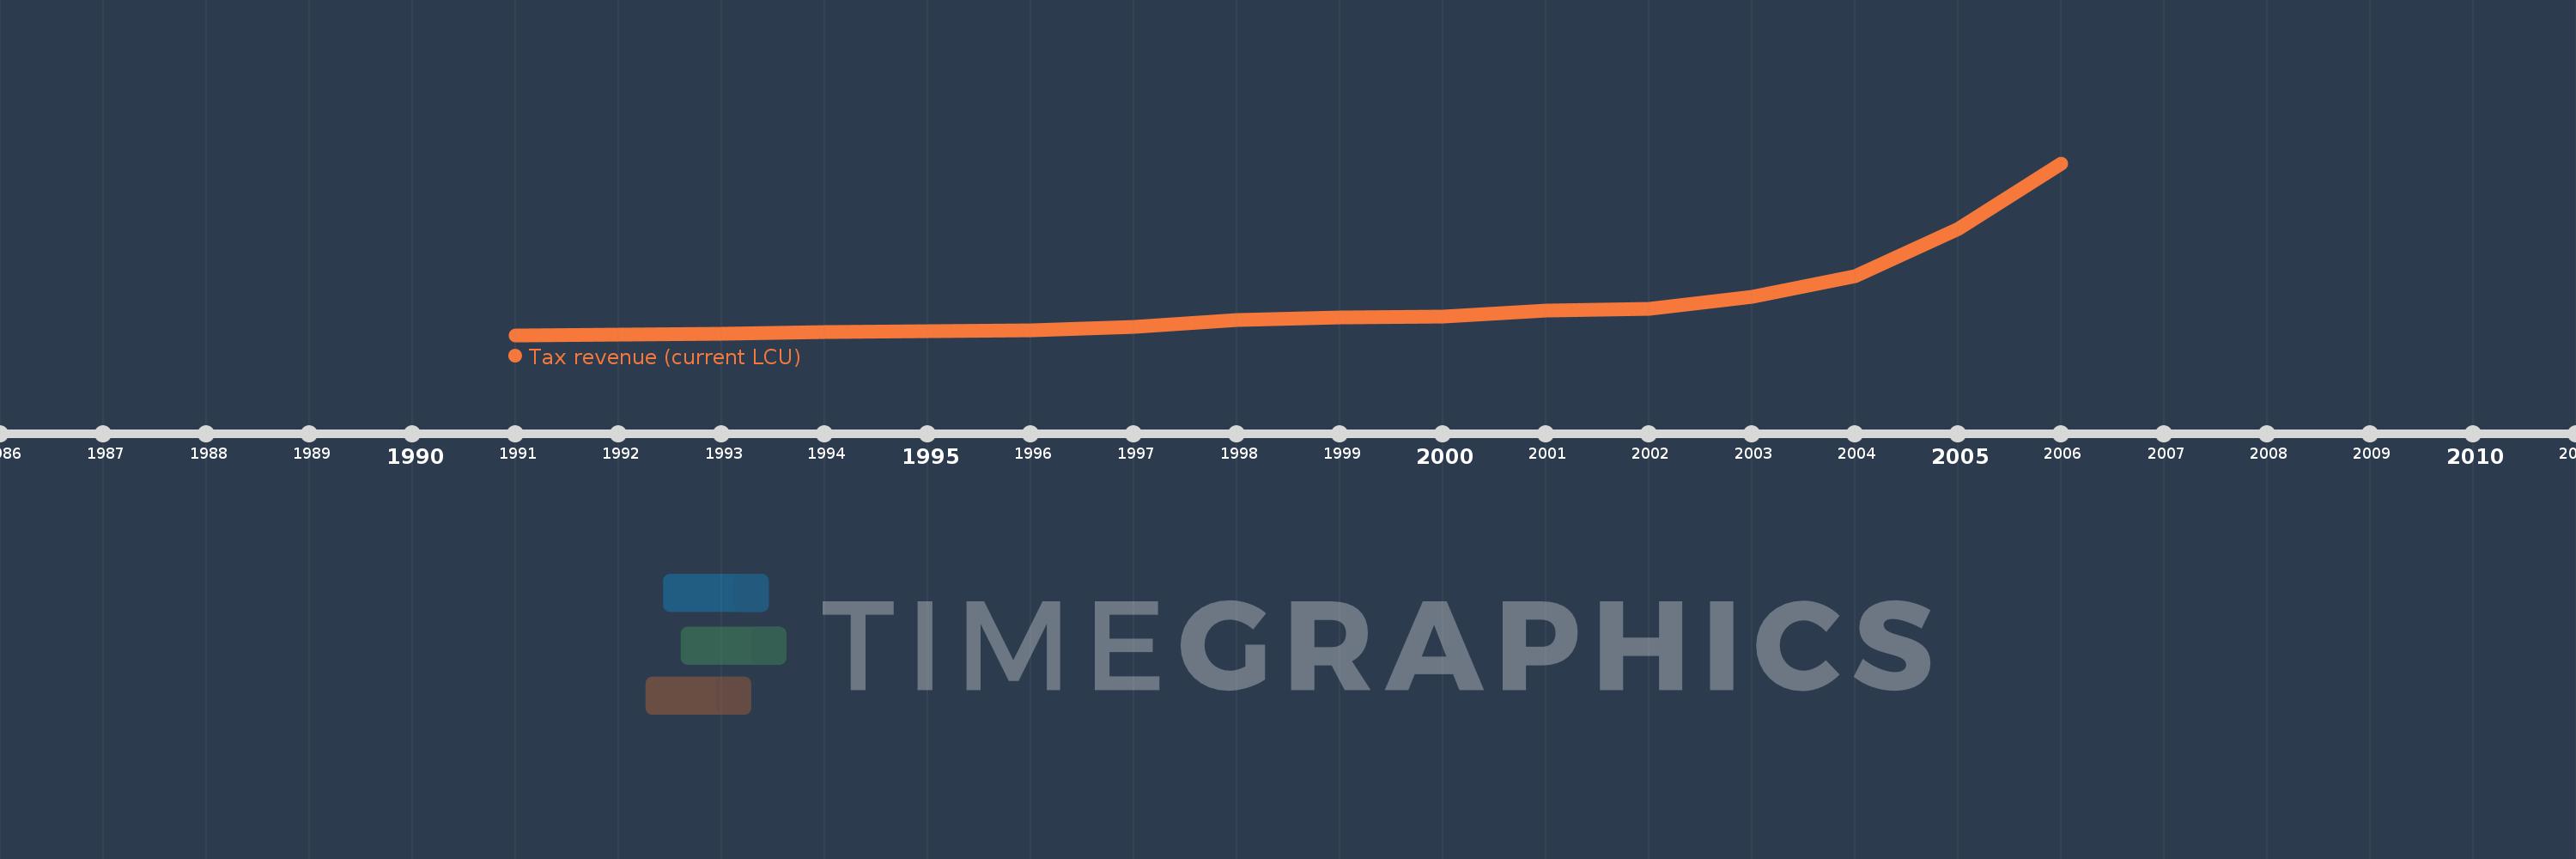
Tax revenue (current LCU)
2006,2005,2004,2003,2002,2001,2000,1999,1998,1997,1996,1995,1994,1993,1992,1991
This statistics in other country:
AfghanistanAlbaniaAlgeriaAngolaAntigua and BarbudaArgentinaArmeniaAustraliaAustriaAzerbaijanBahamas, TheBahrainBangladeshBarbadosBelarusBelgiumBelizeBeninBhutanBoliviaBosnia and HerzegovinaBotswanaBrazilBulgariaBurkina FasoBurundiCabo VerdeCambodiaCanadaCentral African RepublicChileChinaColombiaCongo, Dem. Rep.Congo, Rep.Costa RicaCote d'IvoireCroatiaCyprusCzech RepublicDenmarkDominicaDominican RepublicEgypt, Arab Rep.El SalvadorEquatorial GuineaEstoniaEthiopiaFijiFinlandFranceGambia, TheGeorgiaGermanyGhanaGreeceGrenadaGuatemalaHondurasHong Kong SAR, ChinaHungaryIcelandIndiaIndonesiaIran, Islamic Rep.IraqIrelandIsraelItalyJamaicaJapanJordanKazakhstanKenyaKiribatiKorea, Rep.KuwaitKyrgyz RepublicLao PDRLatviaLebanonLesothoLiberiaLithuaniaLuxembourgMacao SAR, ChinaMacedonia, FYRMadagascarMalawiMalaysiaMaldivesMaliMaltaMauritiusMexicoMicronesia, Fed. Sts.MoldovaMongoliaMoroccoMozambiqueMyanmarNamibiaNepalNetherlandsNew ZealandNicaraguaNigeriaNorwayOmanPakistanPanamaPapua New GuineaParaguayPeruPhilippinesPolandPortugalQatarRomaniaRussian FederationRwandaSamoaSan MarinoSao Tome and PrincipeSenegalSerbiaSeychellesSierra LeoneSingaporeSlovak RepublicSloveniaSolomon IslandsSouth AfricaSpainSri LankaSt. Kitts and NevisSt. LuciaSt. Vincent and the GrenadinesSurinameSwazilandSwedenSwitzerlandSyrian Arab RepublicTajikistanTanzaniaThailandTimor-LesteTogoTrinidad and TobagoTunisiaTurkeyUgandaUkraineUnited Arab EmiratesUnited KingdomUnited StatesUruguayVanuatuVenezuela, RBVietnamWest Bank and GazaYemen, Rep.ZambiaZimbabwe Timeline:
This timeline shows a graph from 1991 to 2006 of Myanmar. No data until 1990. Number of actual observations by date: 16.
Source name:
World Development Indicators
Source organization:
International Monetary Fund, Government Finance Statistics Yearbook and data files.
Categories, topics:
Public Sector
Last updated:
apr 23, 2017
Indicators value changes by year
Minimum:
9.417 bln
jan 1, 1991
Maximum:
476.945 bln
jan 1, 2006
At the date of observation
Value
Absolute change
Change from previous value
jan 1, 1991
9.417 bln
+9.417 bln
0.0%
jan 1, 1992
10.48 bln
+1.063 bln
11.29%
jan 1, 1993
12.563 bln
+2.083 bln
19.88%
jan 1, 1994
17.036 bln
+4.473 bln
35.6%
jan 1, 1995
20.101 bln
+3.065 bln
17.99%
jan 1, 1996
22.644 bln
+2.543 bln
12.65%
jan 1, 1997
31.357 bln
+8.713 bln
38.48%
jan 1, 1998
49.429 bln
+18.072 bln
57.63%
jan 1, 1999
56.653 bln
+7.224 bln
14.61%
jan 1, 2000
60.294 bln
+3.641 bln
6.43%
jan 1, 2001
75.727 bln
+15.433 bln
25.6%
jan 1, 2002
80.094 bln
+4.367 bln
5.77%
jan 1, 2003
112.564 bln
+32.47 bln
40.54%
jan 1, 2004
170.569 bln
+58.005 bln
51.53%
jan 1, 2005
297.104 bln
+126.535 bln
74.18%
jan 1, 2006
476.945 bln
+179.841 bln
60.53%
Ranking of countries by current statistics by years


Comments: