29
/
en
AIzaSyAYiBZKx7MnpbEhh9jyipgxe19OcubqV5w
April 1, 2024
242163
Slovak Republic
SVK
true
2
1
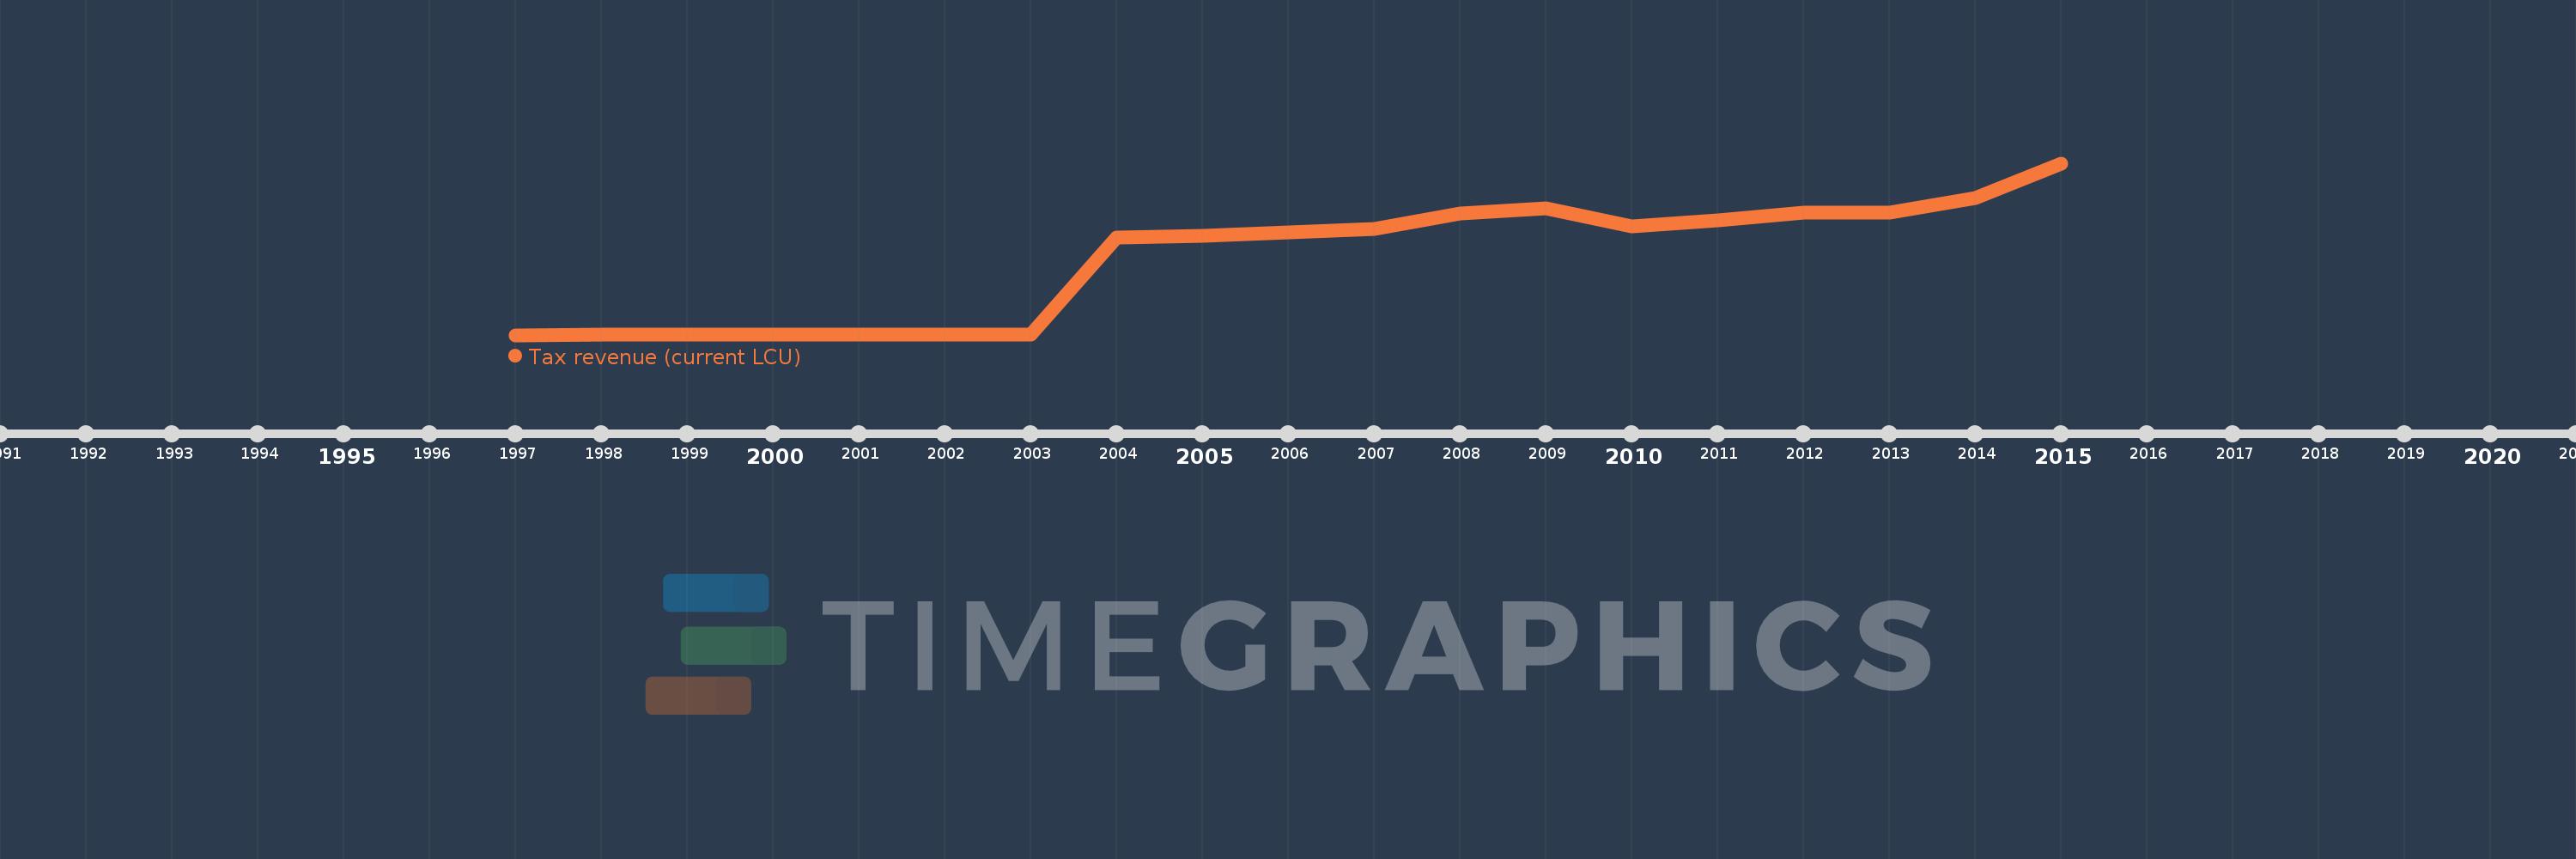
Tax revenue (current LCU)
2015,2014,2013,2012,2011,2010,2009,2008,2007,2006,2005,2004,2003,2002,2001,2000,1999,1998,1997
This statistics in other country:
AfghanistanAlbaniaAlgeriaAngolaAntigua and BarbudaArgentinaArmeniaAustraliaAustriaAzerbaijanBahamas, TheBahrainBangladeshBarbadosBelarusBelgiumBelizeBeninBhutanBoliviaBosnia and HerzegovinaBotswanaBrazilBulgariaBurkina FasoBurundiCabo VerdeCambodiaCanadaCentral African RepublicChileChinaColombiaCongo, Dem. Rep.Congo, Rep.Costa RicaCote d'IvoireCroatiaCyprusCzech RepublicDenmarkDominicaDominican RepublicEgypt, Arab Rep.El SalvadorEquatorial GuineaEstoniaEthiopiaFijiFinlandFranceGambia, TheGeorgiaGermanyGhanaGreeceGrenadaGuatemalaHondurasHong Kong SAR, ChinaHungaryIcelandIndiaIndonesiaIran, Islamic Rep.IraqIrelandIsraelItalyJamaicaJapanJordanKazakhstanKenyaKiribatiKorea, Rep.KuwaitKyrgyz RepublicLao PDRLatviaLebanonLesothoLiberiaLithuaniaLuxembourgMacao SAR, ChinaMacedonia, FYRMadagascarMalawiMalaysiaMaldivesMaliMaltaMauritiusMexicoMicronesia, Fed. Sts.MoldovaMongoliaMoroccoMozambiqueMyanmarNamibiaNepalNetherlandsNew ZealandNicaraguaNigeriaNorwayOmanPakistanPanamaPapua New GuineaParaguayPeruPhilippinesPolandPortugalQatarRomaniaRussian FederationRwandaSamoaSan MarinoSao Tome and PrincipeSenegalSerbiaSeychellesSierra LeoneSingaporeSlovak RepublicSloveniaSolomon IslandsSouth AfricaSpainSri LankaSt. Kitts and NevisSt. LuciaSt. Vincent and the GrenadinesSurinameSwazilandSwedenSwitzerlandSyrian Arab RepublicTajikistanTanzaniaThailandTimor-LesteTogoTrinidad and TobagoTunisiaTurkeyUgandaUkraineUnited Arab EmiratesUnited KingdomUnited StatesUruguayVanuatuVenezuela, RBVietnamWest Bank and GazaYemen, Rep.ZambiaZimbabwe Timeline:
This timeline shows a graph from 1997 to 2015 of Slovak Republic. No data until 1996. Number of actual observations by date: 19.
Source name:
World Development Indicators
Source organization:
International Monetary Fund, Government Finance Statistics Yearbook and data files.
Categories, topics:
Public Sector
Last updated:
apr 23, 2017
Indicators value changes by year
Minimum:
154.399 mln
jan 1, 1997
Maximum:
12.075 bln
jan 1, 2015
At the date of observation
Value
Absolute change
Change from previous value
jan 1, 1997
154.399 mln
+154.399 mln
0.0%
jan 1, 1998
160.348 mln
+5.949 mln
3.85%
jan 1, 1999
168.557 mln
+8.209 mln
5.12%
jan 1, 2000
176.774 mln
+8.217 mln
4.88%
jan 1, 2001
191.528 mln
+14.754 mln
8.35%
jan 1, 2002
181.885 mln
-9.643 mln
-5.03%
jan 1, 2003
208.075 mln
+26.191 mln
14.4%
jan 1, 2004
6.913 bln
+6.705 bln
3.22K%
jan 1, 2005
7.066 bln
+153.223 mln
2.22%
jan 1, 2006
7.261 bln
+194.782 mln
2.76%
jan 1, 2007
7.542 bln
+281.551 mln
3.88%
jan 1, 2008
8.599 bln
+1.057 bln
14.01%
jan 1, 2009
8.929 bln
+329.711 mln
3.83%
jan 1, 2010
7.707 bln
-1.222 bln
-13.68%
jan 1, 2011
8.104 bln
+397.364 mln
5.16%
jan 1, 2012
8.657 bln
+552.386 mln
6.82%
jan 1, 2013
8.671 bln
+13.889 mln
0.16%
jan 1, 2014
9.688 bln
+1.017 bln
11.73%
jan 1, 2015
12.075 bln
+2.388 bln
24.65%
Ranking of countries by current statistics by years


Comments: