29
/
en
AIzaSyAYiBZKx7MnpbEhh9jyipgxe19OcubqV5w
April 1, 2024
82288
Belgium
BEL
true
2
1
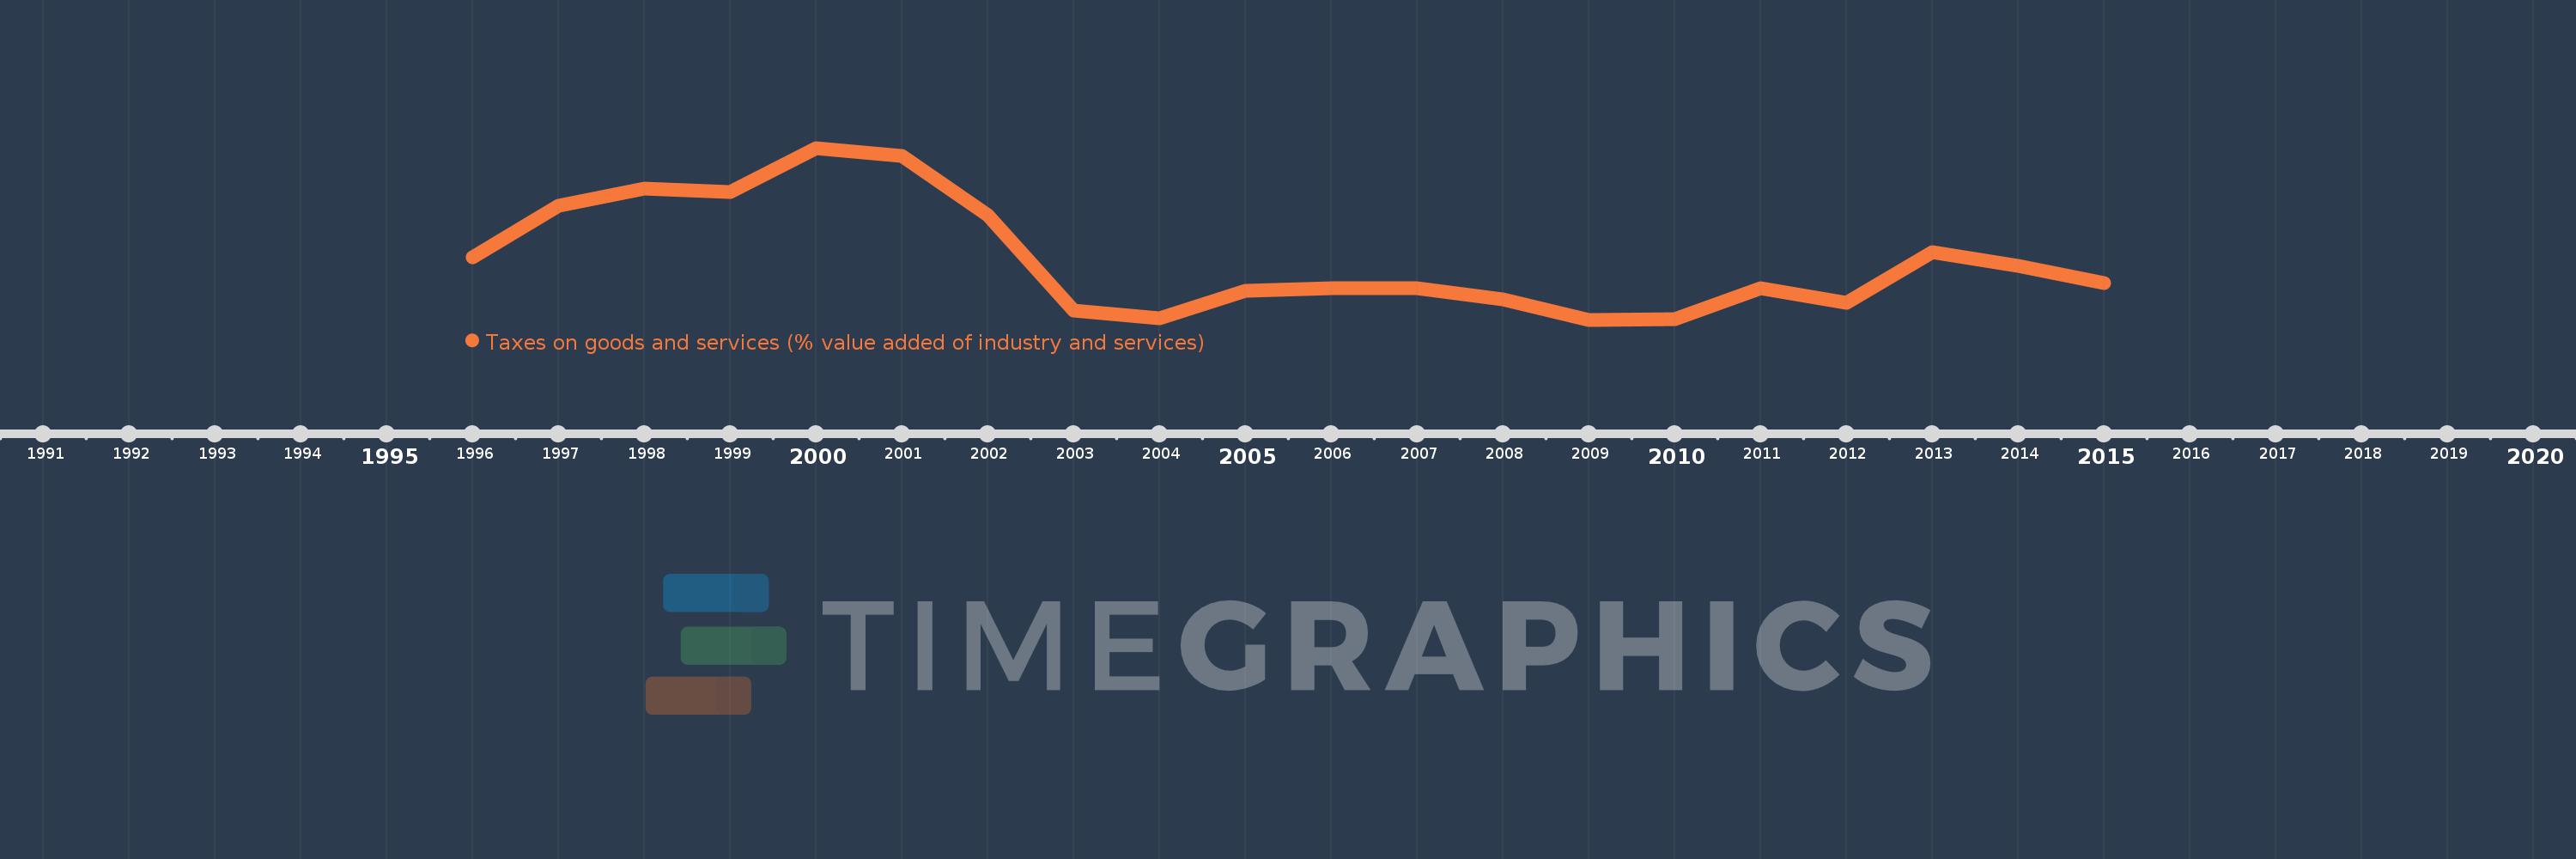
Taxes on goods and services (% value added of industry and services)
2015,2014,2013,2012,2011,2010,2009,2008,2007,2006,2005,2004,2003,2002,2001,2000,1999,1998,1997,1996
This statistics in other country:
AfghanistanAlbaniaAlgeriaAngolaAntigua and BarbudaArgentinaArmeniaAustraliaAustriaAzerbaijanBahrainBangladeshBarbadosBelarusBelgiumBelizeBeninBhutanBoliviaBosnia and HerzegovinaBotswanaBrazilBulgariaBurkina FasoBurundiCabo VerdeCambodiaCanadaCentral African RepublicChileChinaColombiaCongo, Dem. Rep.Congo, Rep.Costa RicaCote d'IvoireCroatiaCyprusCzech RepublicDenmarkDominicaDominican RepublicEgypt, Arab Rep.El SalvadorEquatorial GuineaEstoniaEthiopiaFijiFinlandFranceGambia, TheGeorgiaGermanyGhanaGreeceGrenadaGuatemalaHondurasHong Kong SAR, ChinaHungaryIcelandIndiaIndonesiaIran, Islamic Rep.IraqIrelandItalyJamaicaJapanJordanKazakhstanKenyaKiribatiKorea, Rep.Kyrgyz RepublicLao PDRLatviaLebanonLesothoLiberiaLithuaniaLuxembourgMacao SAR, ChinaMacedonia, FYRMadagascarMalawiMalaysiaMaldivesMaliMaltaMauritiusMexicoMicronesia, Fed. Sts.MoldovaMongoliaMoroccoMozambiqueMyanmarNamibiaNepalNetherlandsNew ZealandNicaraguaNigeriaNorwayOmanPakistanPanamaPapua New GuineaParaguayPeruPhilippinesPolandPortugalRomaniaRussian FederationRwandaSamoaSao Tome and PrincipeSenegalSerbiaSeychellesSierra LeoneSingaporeSlovak RepublicSloveniaSouth AfricaSpainSri LankaSt. Kitts and NevisSt. LuciaSurinameSwazilandSwedenSwitzerlandSyrian Arab RepublicTajikistanTanzaniaThailandTimor-LesteTogoTrinidad and TobagoTunisiaTurkeyUgandaUkraineUnited Arab EmiratesUnited KingdomUnited StatesUruguayVanuatuVenezuela, RBVietnamWest Bank and GazaYemen, Rep.ZambiaZimbabwe Timeline:
This timeline shows a graph from 1996 to 2015 of Belgium. No data until 1995. Number of actual observations by date: 20.
Source name:
World Development Indicators
Source organization:
International Monetary Fund, Government Finance Statistics Yearbook and data files, and World Bank and OECD value added estimates.
Categories, topics:
Public Sector
Last updated:
apr 23, 2017
Indicators value changes by year
Minimum:
11.189
jan 1, 2009
Maximum:
12.908
jan 1, 2000
At the date of observation
Value
Absolute change
Change from previous value
jan 1, 1996
11.813
+11.813
0.0%
jan 1, 1997
12.328
+0.515
4.36%
jan 1, 1998
12.505
+0.178
1.44%
jan 1, 1999
12.465
-0.04
-0.32%
jan 1, 2000
12.908
+0.443
3.55%
jan 1, 2001
12.831
-0.077
-0.6%
jan 1, 2002
12.232
-0.599
-4.67%
jan 1, 2003
11.283
-0.948
-7.75%
jan 1, 2004
11.2
-0.083
-0.73%
jan 1, 2005
11.48
+0.279
2.49%
jan 1, 2006
11.506
+0.026
0.23%
jan 1, 2007
11.502
-0.004
-0.04%
jan 1, 2008
11.396
-0.106
-0.92%
jan 1, 2009
11.189
-0.207
-1.81%
jan 1, 2010
11.192
+0.003
0.03%
jan 1, 2011
11.505
+0.312
2.79%
jan 1, 2012
11.361
-0.144
-1.25%
jan 1, 2013
11.869
+0.508
4.47%
jan 1, 2014
11.728
-0.141
-1.19%
jan 1, 2015
11.553
-0.174
-1.49%
Ranking of countries by current statistics by years


Comments: