29
/
en
AIzaSyAYiBZKx7MnpbEhh9jyipgxe19OcubqV5w
April 1, 2024
202351
Morocco
MAR
true
2
1
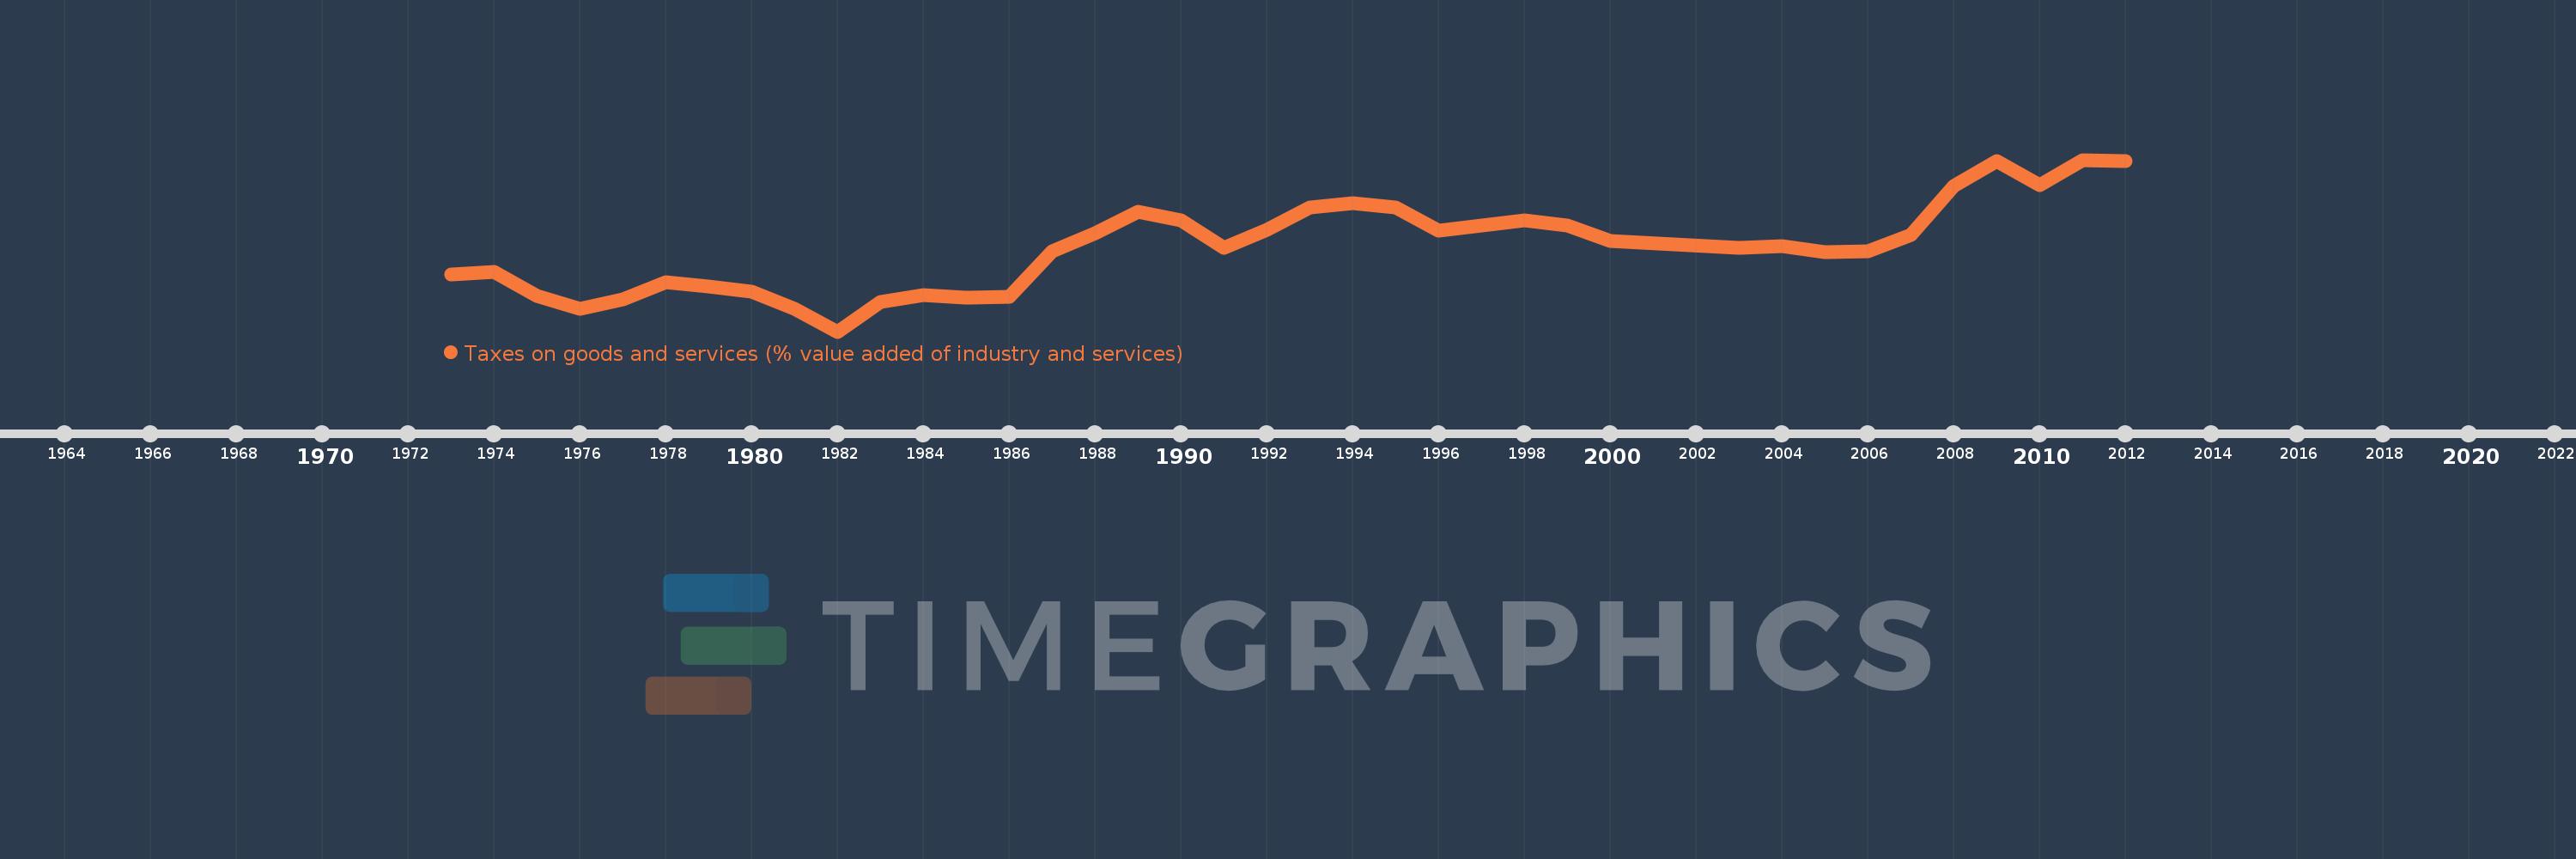
Taxes on goods and services (% value added of industry and services)
2012,2011,2010,2009,2008,2007,2006,2005,2004,2003,2000,1999,1998,1996,1995,1994,1993,1992,1991,1990,1989,1988,1987,1986,1985,1984,1983,1982,1981,1980,1979,1978,1977,1976,1975,1974,1973
This statistics in other country:
AfghanistanAlbaniaAlgeriaAngolaAntigua and BarbudaArgentinaArmeniaAustraliaAustriaAzerbaijanBahrainBangladeshBarbadosBelarusBelgiumBelizeBeninBhutanBoliviaBosnia and HerzegovinaBotswanaBrazilBulgariaBurkina FasoBurundiCabo VerdeCambodiaCanadaCentral African RepublicChileChinaColombiaCongo, Dem. Rep.Congo, Rep.Costa RicaCote d'IvoireCroatiaCyprusCzech RepublicDenmarkDominicaDominican RepublicEgypt, Arab Rep.El SalvadorEquatorial GuineaEstoniaEthiopiaFijiFinlandFranceGambia, TheGeorgiaGermanyGhanaGreeceGrenadaGuatemalaHondurasHong Kong SAR, ChinaHungaryIcelandIndiaIndonesiaIran, Islamic Rep.IraqIrelandItalyJamaicaJapanJordanKazakhstanKenyaKiribatiKorea, Rep.Kyrgyz RepublicLao PDRLatviaLebanonLesothoLiberiaLithuaniaLuxembourgMacao SAR, ChinaMacedonia, FYRMadagascarMalawiMalaysiaMaldivesMaliMaltaMauritiusMexicoMicronesia, Fed. Sts.MoldovaMongoliaMoroccoMozambiqueMyanmarNamibiaNepalNetherlandsNew ZealandNicaraguaNigeriaNorwayOmanPakistanPanamaPapua New GuineaParaguayPeruPhilippinesPolandPortugalRomaniaRussian FederationRwandaSamoaSao Tome and PrincipeSenegalSerbiaSeychellesSierra LeoneSingaporeSlovak RepublicSloveniaSouth AfricaSpainSri LankaSt. Kitts and NevisSt. LuciaSurinameSwazilandSwedenSwitzerlandSyrian Arab RepublicTajikistanTanzaniaThailandTimor-LesteTogoTrinidad and TobagoTunisiaTurkeyUgandaUkraineUnited Arab EmiratesUnited KingdomUnited StatesUruguayVanuatuVenezuela, RBVietnamWest Bank and GazaYemen, Rep.ZambiaZimbabwe Timeline:
This timeline shows a graph from 1973 to 2012 of Morocco. No data until 1972. Number of actual observations by date: 37.
Source name:
World Development Indicators
Source organization:
International Monetary Fund, Government Finance Statistics Yearbook and data files, and World Bank and OECD value added estimates.
Categories, topics:
Public Sector
Last updated:
apr 23, 2017
Indicators value changes by year
Maximum:
16.156
jan 1, 2011
At the date of observation
Value
Absolute change
Change from previous value
jan 1, 1973
11.315
+11.315
0.0%
jan 1, 1974
11.415
+0.101
0.89%
jan 1, 1975
10.405
-1.01
-8.85%
jan 1, 1976
9.835
-0.57
-5.48%
jan 1, 1977
10.242
+0.408
4.14%
jan 1, 1978
10.967
+0.724
7.07%
jan 1, 1979
10.781
-0.186
-1.7%
jan 1, 1980
10.586
-0.195
-1.81%
jan 1, 1981
9.859
-0.726
-6.86%
jan 1, 1982
8.887
-0.972
-9.86%
jan 1, 1983
10.136
+1.249
14.05%
jan 1, 1984
10.435
+0.298
2.94%
jan 1, 1985
10.313
-0.122
-1.17%
jan 1, 1986
10.359
+0.047
0.45%
jan 1, 1987
12.294
+1.935
18.68%
jan 1, 1988
13.046
+0.752
6.12%
jan 1, 1989
13.942
+0.896
6.87%
jan 1, 1990
13.602
-0.34
-2.44%
jan 1, 1991
12.419
-1.182
-8.69%
jan 1, 1992
13.179
+0.76
6.12%
jan 1, 1993
14.157
+0.977
7.42%
jan 1, 1994
14.316
+0.159
1.12%
jan 1, 1995
14.15
-0.166
-1.16%
jan 1, 1996
13.154
-0.996
-7.04%
jan 1, 1998
13.579
+0.425
3.23%
jan 1, 1999
13.392
-0.187
-1.38%
jan 1, 2000
12.718
-0.674
-5.03%
jan 1, 2003
12.418
-0.3
-2.36%
jan 1, 2004
12.511
+0.093
0.75%
jan 1, 2005
12.248
-0.263
-2.1%
jan 1, 2006
12.281
+0.033
0.27%
jan 1, 2007
12.96
+0.679
5.53%
jan 1, 2008
15.057
+2.097
16.18%
jan 1, 2009
16.116
+1.06
7.04%
jan 1, 2010
15.098
-1.018
-6.32%
jan 1, 2011
16.156
+1.058
7.01%
jan 1, 2012
16.101
-0.055
-0.34%
Ranking of countries by current statistics by years


Comments: