29
/
en
AIzaSyAYiBZKx7MnpbEhh9jyipgxe19OcubqV5w
April 1, 2024
189681
Maldives
MDV
true
2
1
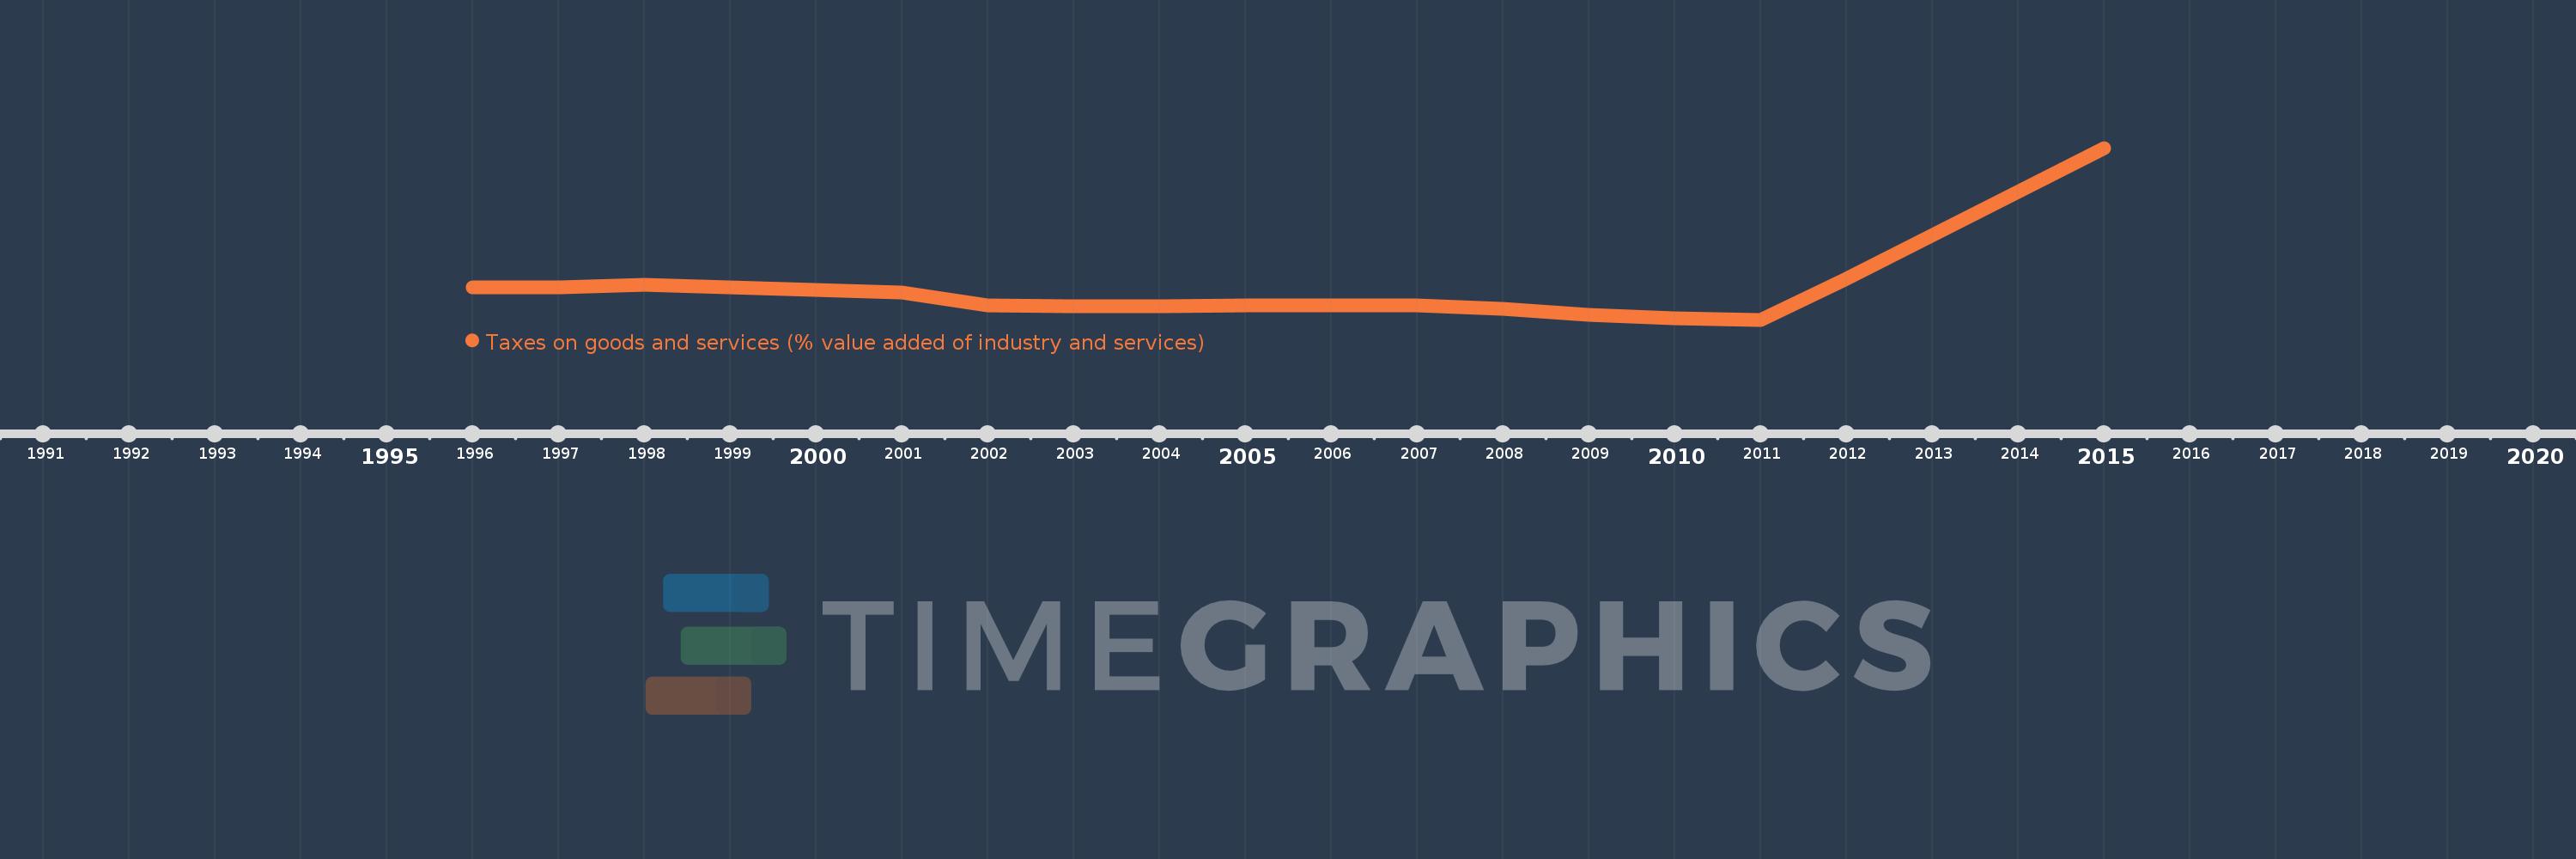
Taxes on goods and services (% value added of industry and services)
2015,2012,2011,2010,2009,2008,2007,2005,2004,2003,2002,2001,2000,1999,1998,1997,1996
This statistics in other country:
AfghanistanAlbaniaAlgeriaAngolaAntigua and BarbudaArgentinaArmeniaAustraliaAustriaAzerbaijanBahrainBangladeshBarbadosBelarusBelgiumBelizeBeninBhutanBoliviaBosnia and HerzegovinaBotswanaBrazilBulgariaBurkina FasoBurundiCabo VerdeCambodiaCanadaCentral African RepublicChileChinaColombiaCongo, Dem. Rep.Congo, Rep.Costa RicaCote d'IvoireCroatiaCyprusCzech RepublicDenmarkDominicaDominican RepublicEgypt, Arab Rep.El SalvadorEquatorial GuineaEstoniaEthiopiaFijiFinlandFranceGambia, TheGeorgiaGermanyGhanaGreeceGrenadaGuatemalaHondurasHong Kong SAR, ChinaHungaryIcelandIndiaIndonesiaIran, Islamic Rep.IraqIrelandItalyJamaicaJapanJordanKazakhstanKenyaKiribatiKorea, Rep.Kyrgyz RepublicLao PDRLatviaLebanonLesothoLiberiaLithuaniaLuxembourgMacao SAR, ChinaMacedonia, FYRMadagascarMalawiMalaysiaMaldivesMaliMaltaMauritiusMexicoMicronesia, Fed. Sts.MoldovaMongoliaMoroccoMozambiqueMyanmarNamibiaNepalNetherlandsNew ZealandNicaraguaNigeriaNorwayOmanPakistanPanamaPapua New GuineaParaguayPeruPhilippinesPolandPortugalRomaniaRussian FederationRwandaSamoaSao Tome and PrincipeSenegalSerbiaSeychellesSierra LeoneSingaporeSlovak RepublicSloveniaSouth AfricaSpainSri LankaSt. Kitts and NevisSt. LuciaSurinameSwazilandSwedenSwitzerlandSyrian Arab RepublicTajikistanTanzaniaThailandTimor-LesteTogoTrinidad and TobagoTunisiaTurkeyUgandaUkraineUnited Arab EmiratesUnited KingdomUnited StatesUruguayVanuatuVenezuela, RBVietnamWest Bank and GazaYemen, Rep.ZambiaZimbabwe Timeline:
This timeline shows a graph from 1996 to 2015 of Maldives. No data until 1995. Number of actual observations by date: 17.
Source name:
World Development Indicators
Source organization:
International Monetary Fund, Government Finance Statistics Yearbook and data files, and World Bank and OECD value added estimates.
Categories, topics:
Public Sector
Last updated:
apr 23, 2017
Indicators value changes by year
Maximum:
15.329
jan 1, 2015
At the date of observation
Value
Absolute change
Change from previous value
jan 1, 1996
4.842
+4.842
0.0%
jan 1, 1997
4.856
+0.015
0.31%
jan 1, 1998
5.059
+0.202
4.17%
jan 1, 1999
4.863
-0.196
-3.88%
jan 1, 2000
4.694
-0.169
-3.47%
jan 1, 2001
4.488
-0.206
-4.39%
jan 1, 2002
3.508
-0.98
-21.83%
jan 1, 2003
3.425
-0.084
-2.38%
jan 1, 2004
3.454
+0.029
0.85%
jan 1, 2005
3.482
+0.029
0.83%
jan 1, 2007
3.519
+0.037
1.06%
jan 1, 2008
3.264
-0.256
-7.27%
jan 1, 2009
2.791
-0.473
-14.49%
jan 1, 2010
2.511
-0.28
-10.02%
jan 1, 2011
2.43
-0.081
-3.23%
jan 1, 2012
5.479
+3.049
125.47%
jan 1, 2015
15.329
+9.85
179.78%
Ranking of countries by current statistics by years


Comments: