30
/
AIzaSyAYiBZKx7MnpbEhh9jyipgxe19OcubqV5w
April 1, 2024
259028
Syrian Arab Republic
SYR
true
2
1
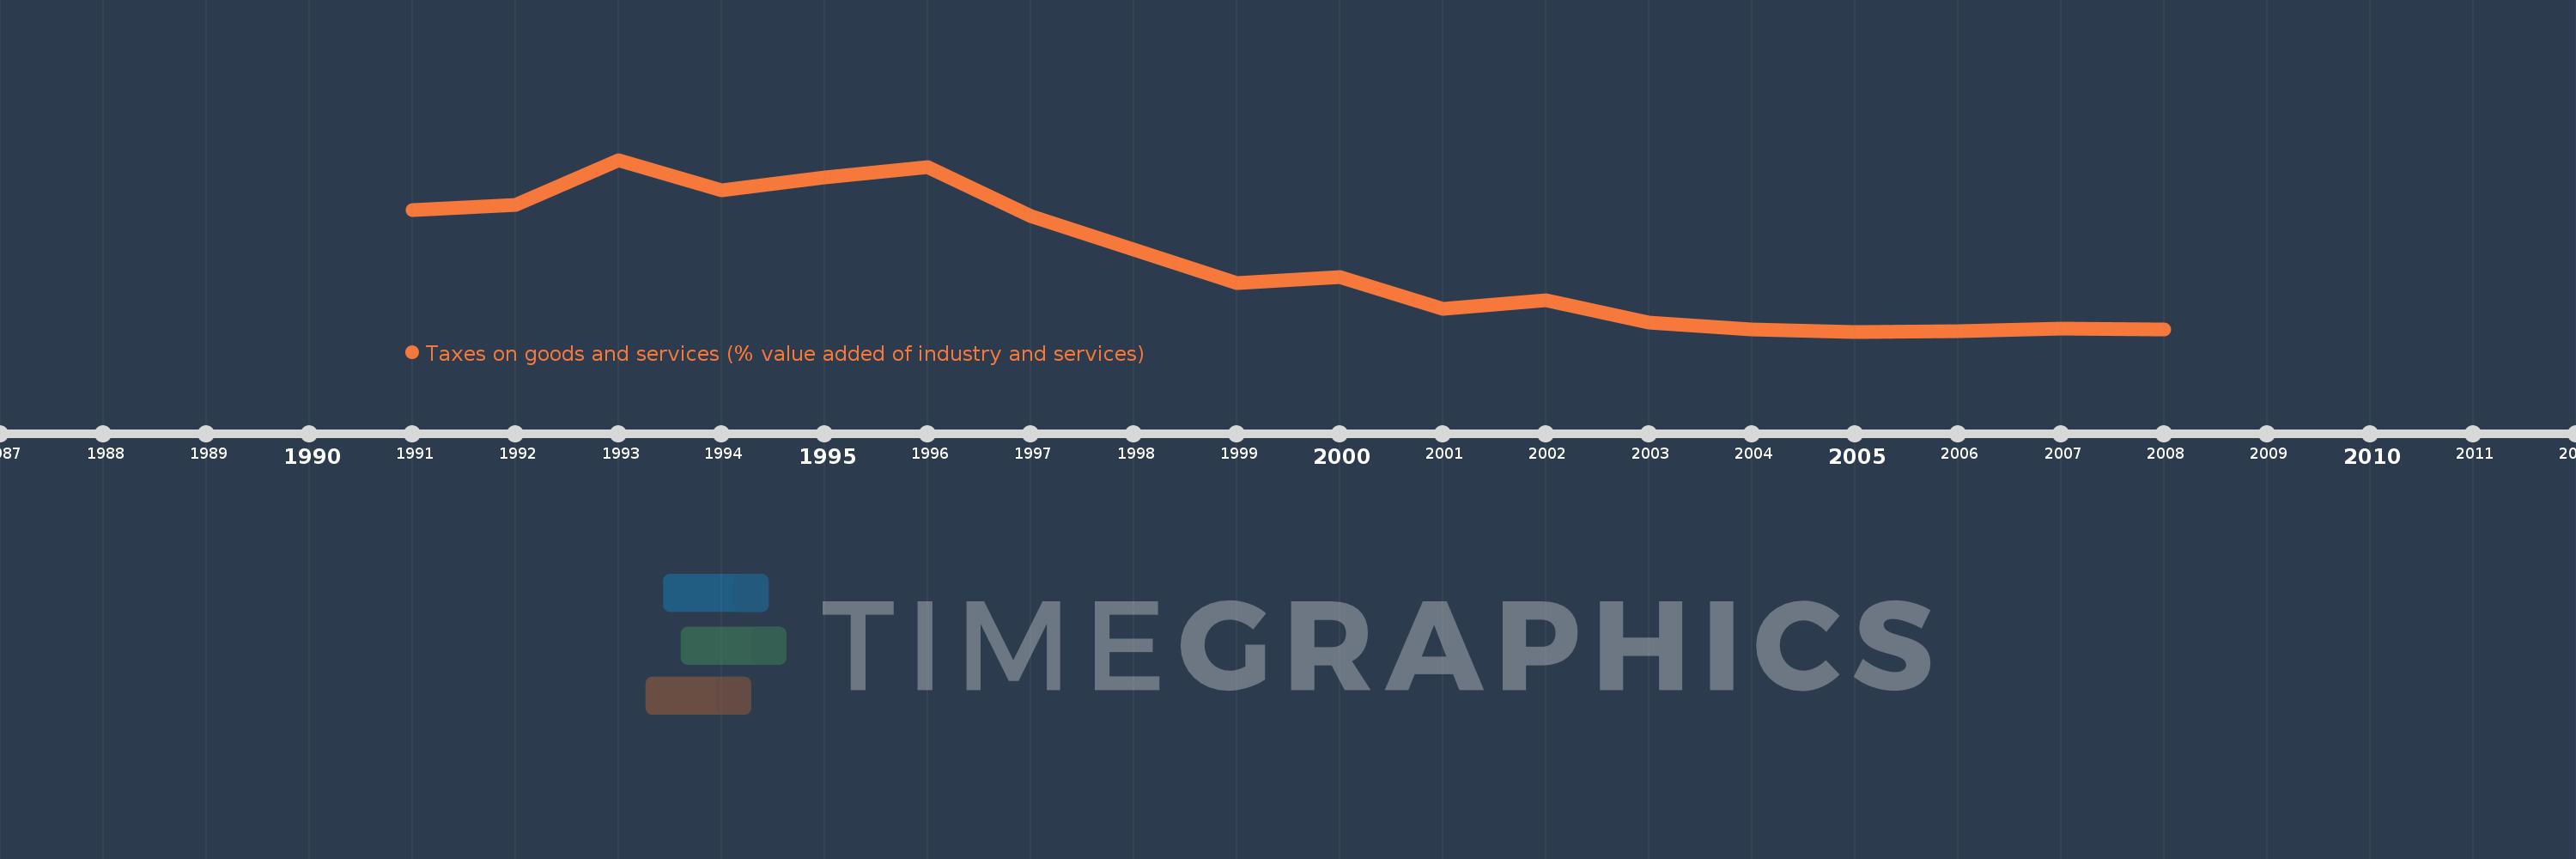
Taxes on goods and services (% value added of industry and services)
2008,2007,2006,2005,2004,2003,2002,2001,2000,1999,1997,1996,1995,1994,1993,1992,1991
