29
/
en
AIzaSyAYiBZKx7MnpbEhh9jyipgxe19OcubqV5w
April 1, 2024
199916
Mongolia
MNG
true
2
1
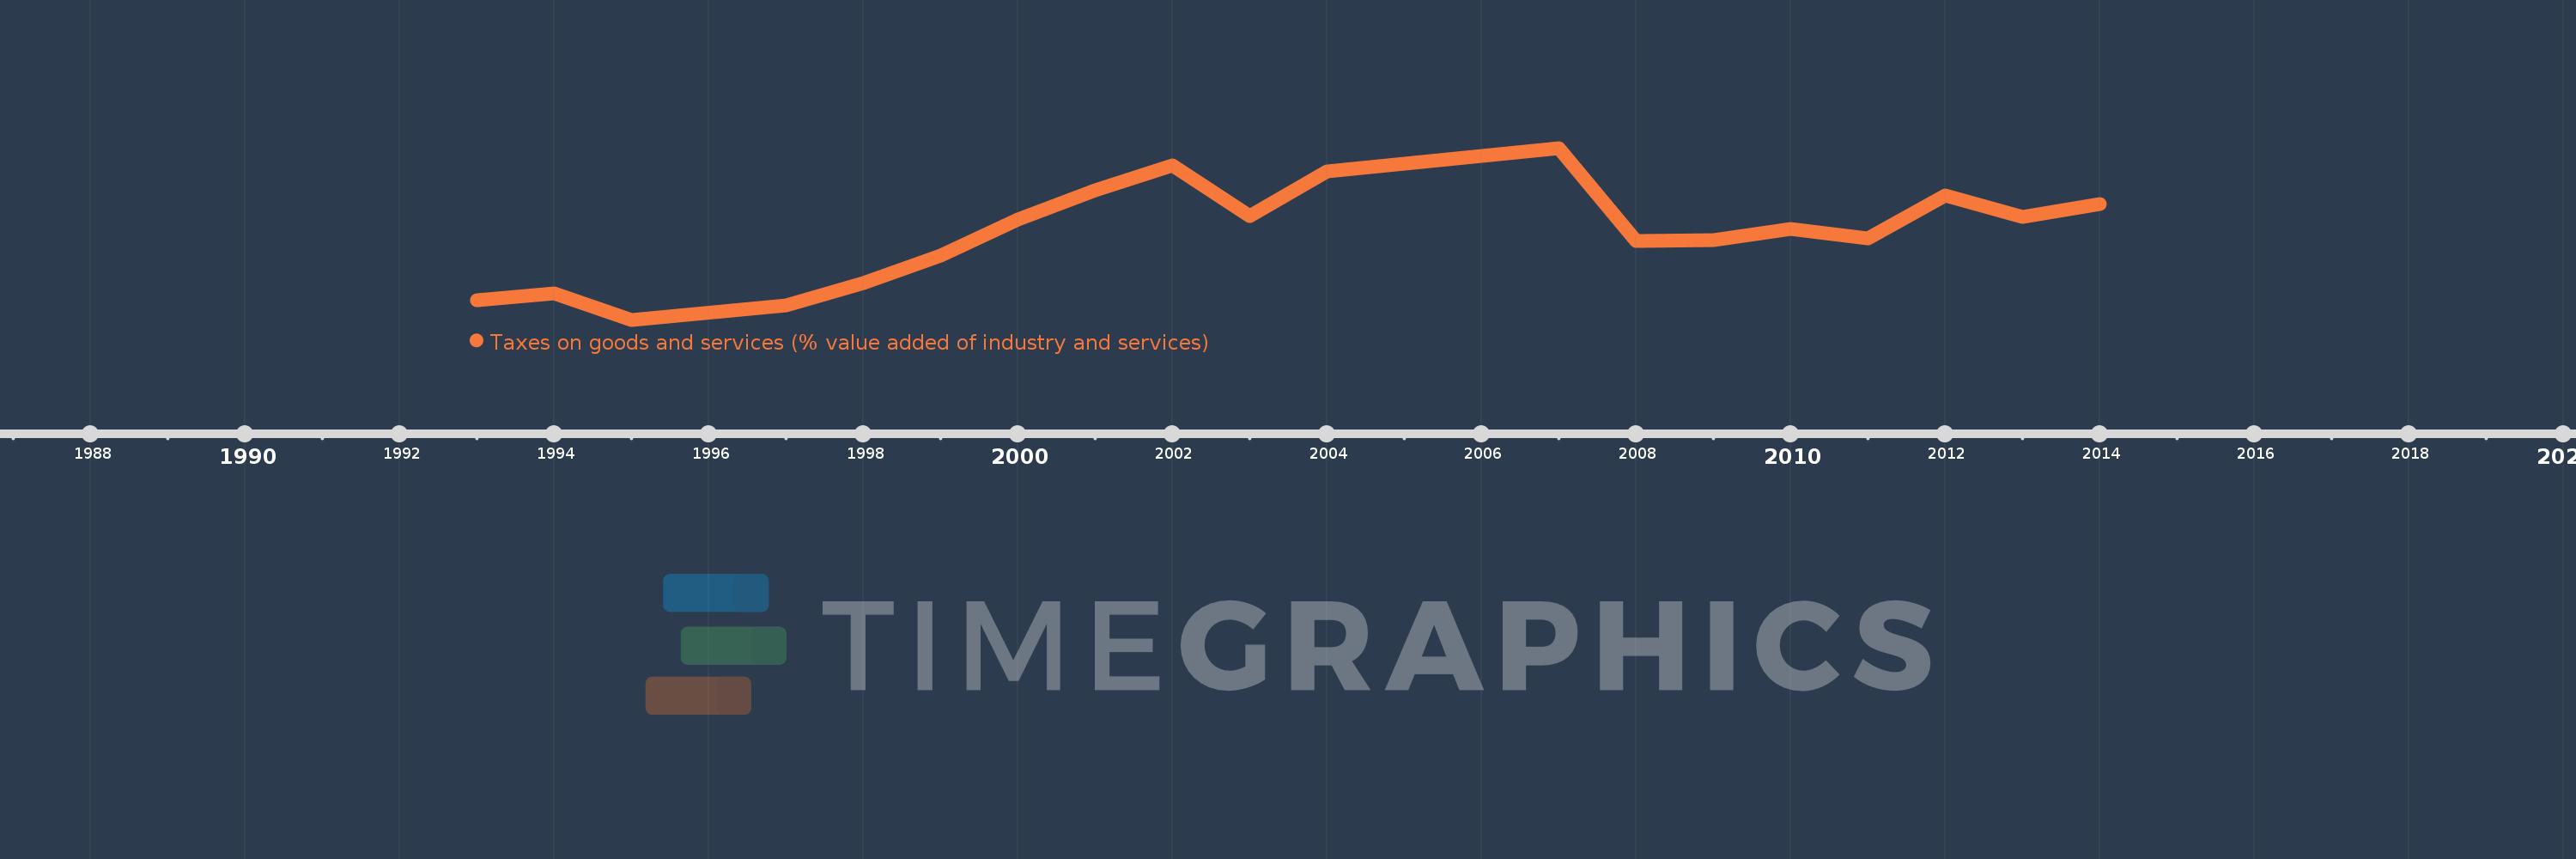
Taxes on goods and services (% value added of industry and services)
2014,2013,2012,2011,2010,2009,2008,2007,2004,2003,2002,2001,2000,1999,1998,1997,1995,1994,1993
This statistics in other country:
AfghanistanAlbaniaAlgeriaAngolaAntigua and BarbudaArgentinaArmeniaAustraliaAustriaAzerbaijanBahrainBangladeshBarbadosBelarusBelgiumBelizeBeninBhutanBoliviaBosnia and HerzegovinaBotswanaBrazilBulgariaBurkina FasoBurundiCabo VerdeCambodiaCanadaCentral African RepublicChileChinaColombiaCongo, Dem. Rep.Congo, Rep.Costa RicaCote d'IvoireCroatiaCyprusCzech RepublicDenmarkDominicaDominican RepublicEgypt, Arab Rep.El SalvadorEquatorial GuineaEstoniaEthiopiaFijiFinlandFranceGambia, TheGeorgiaGermanyGhanaGreeceGrenadaGuatemalaHondurasHong Kong SAR, ChinaHungaryIcelandIndiaIndonesiaIran, Islamic Rep.IraqIrelandItalyJamaicaJapanJordanKazakhstanKenyaKiribatiKorea, Rep.Kyrgyz RepublicLao PDRLatviaLebanonLesothoLiberiaLithuaniaLuxembourgMacao SAR, ChinaMacedonia, FYRMadagascarMalawiMalaysiaMaldivesMaliMaltaMauritiusMexicoMicronesia, Fed. Sts.MoldovaMongoliaMoroccoMozambiqueMyanmarNamibiaNepalNetherlandsNew ZealandNicaraguaNigeriaNorwayOmanPakistanPanamaPapua New GuineaParaguayPeruPhilippinesPolandPortugalRomaniaRussian FederationRwandaSamoaSao Tome and PrincipeSenegalSerbiaSeychellesSierra LeoneSingaporeSlovak RepublicSloveniaSouth AfricaSpainSri LankaSt. Kitts and NevisSt. LuciaSurinameSwazilandSwedenSwitzerlandSyrian Arab RepublicTajikistanTanzaniaThailandTimor-LesteTogoTrinidad and TobagoTunisiaTurkeyUgandaUkraineUnited Arab EmiratesUnited KingdomUnited StatesUruguayVanuatuVenezuela, RBVietnamWest Bank and GazaYemen, Rep.ZambiaZimbabwe Timeline:
This timeline shows a graph from 1993 to 2014 of Mongolia. No data until 1992. Number of actual observations by date: 19.
Source name:
World Development Indicators
Source organization:
International Monetary Fund, Government Finance Statistics Yearbook and data files, and World Bank and OECD value added estimates.
Categories, topics:
Public Sector
Last updated:
apr 23, 2017
Indicators value changes by year
Maximum:
17.476
jan 1, 2007
At the date of observation
Value
Absolute change
Change from previous value
jan 1, 1993
6.983
+6.983
0.0%
jan 1, 1994
7.465
+0.482
6.91%
jan 1, 1995
5.618
-1.847
-24.74%
jan 1, 1997
6.604
+0.985
17.54%
jan 1, 1998
8.13
+1.526
23.12%
jan 1, 1999
10.067
+1.937
23.82%
jan 1, 2000
12.551
+2.484
24.68%
jan 1, 2001
14.534
+1.983
15.8%
jan 1, 2002
16.265
+1.731
11.91%
jan 1, 2003
12.752
-3.512
-21.6%
jan 1, 2004
15.864
+3.112
24.4%
jan 1, 2007
17.476
+1.611
10.16%
jan 1, 2008
11.031
-6.445
-36.88%
jan 1, 2009
11.129
+0.099
0.9%
jan 1, 2010
11.893
+0.763
6.86%
jan 1, 2011
11.247
-0.645
-5.43%
jan 1, 2012
14.174
+2.927
26.02%
jan 1, 2013
12.708
-1.466
-10.34%
jan 1, 2014
13.58
+0.872
6.86%
Ranking of countries by current statistics by years


Comments: