29
/
en
AIzaSyAYiBZKx7MnpbEhh9jyipgxe19OcubqV5w
April 1, 2024
162026
Italy
ITA
true
2
1
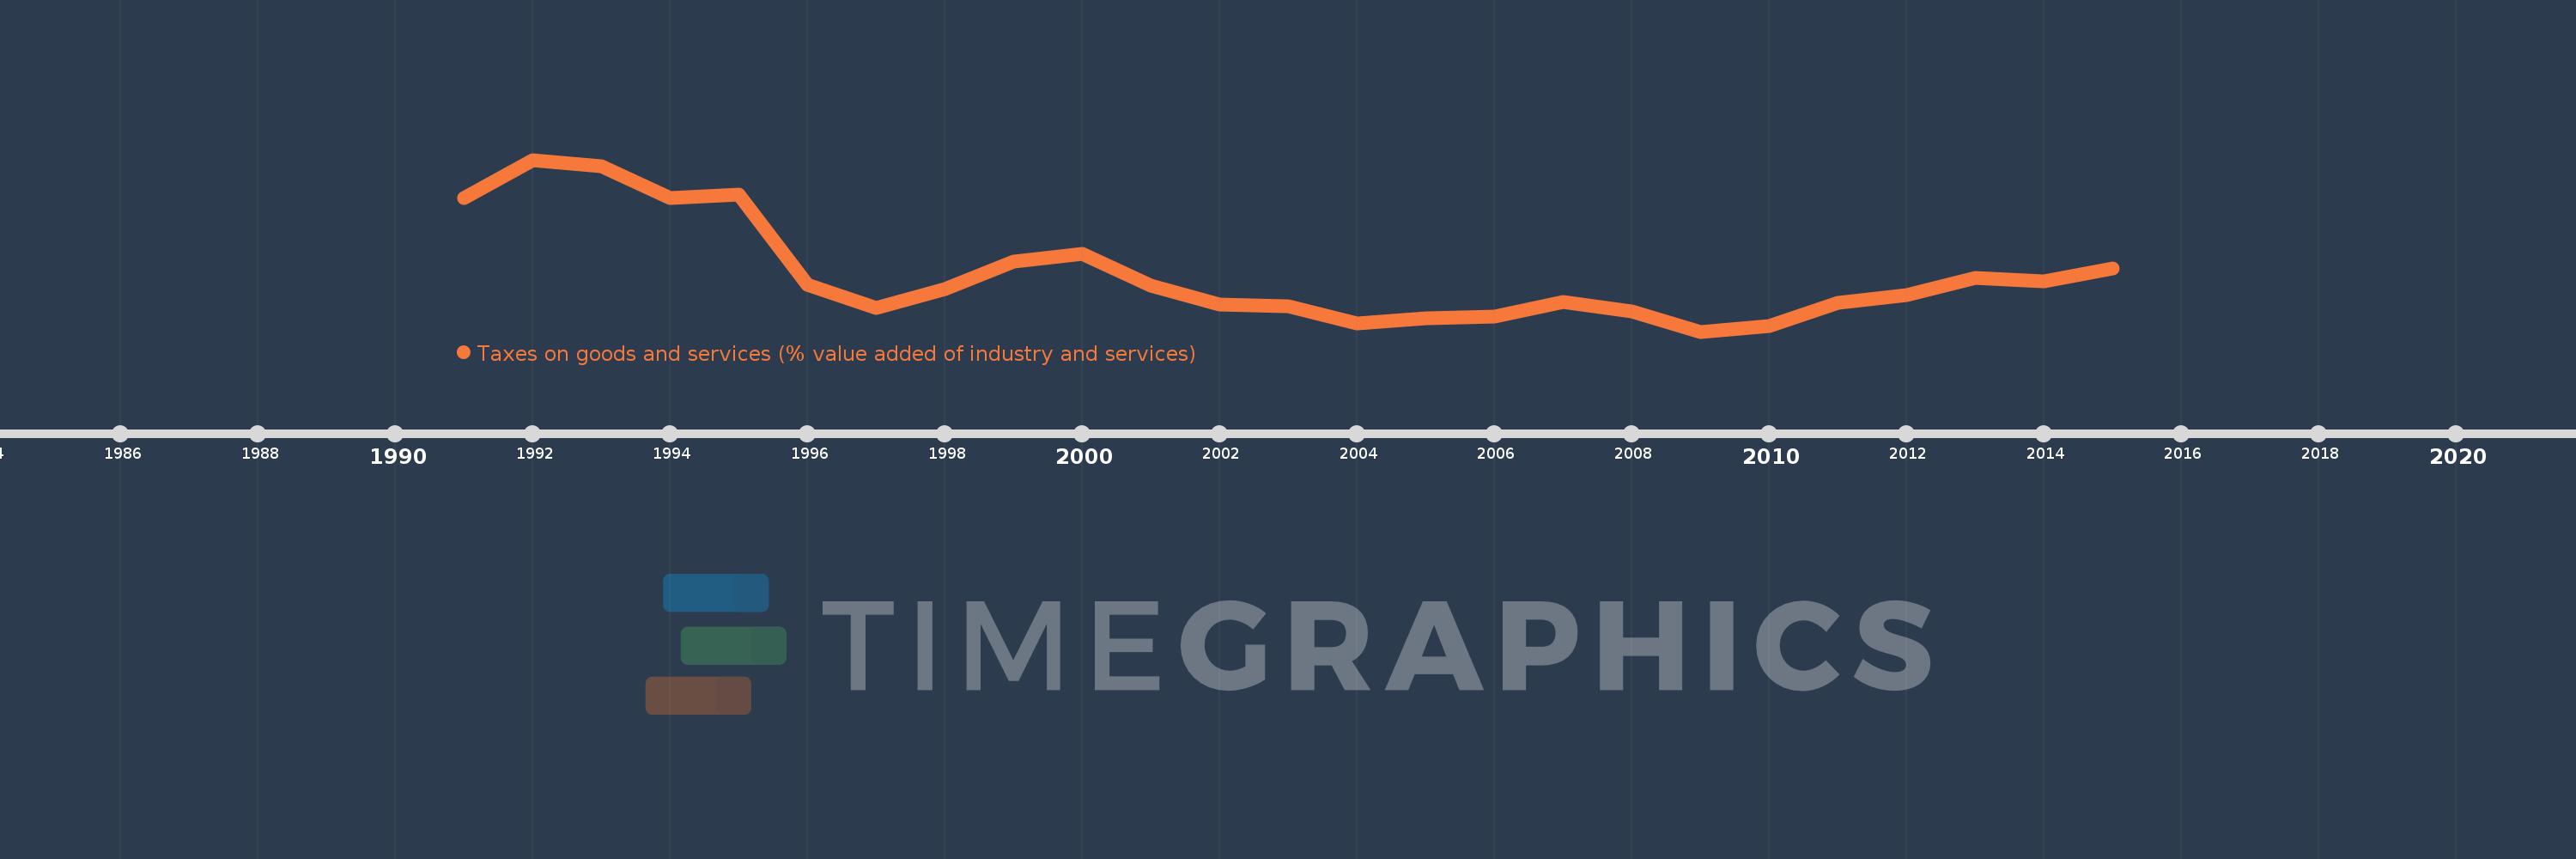
Taxes on goods and services (% value added of industry and services)
2015,2014,2013,2012,2011,2010,2009,2008,2007,2006,2005,2004,2003,2002,2001,2000,1999,1998,1997,1996,1995,1994,1993,1992,1991
This statistics in other country:
AfghanistanAlbaniaAlgeriaAngolaAntigua and BarbudaArgentinaArmeniaAustraliaAustriaAzerbaijanBahrainBangladeshBarbadosBelarusBelgiumBelizeBeninBhutanBoliviaBosnia and HerzegovinaBotswanaBrazilBulgariaBurkina FasoBurundiCabo VerdeCambodiaCanadaCentral African RepublicChileChinaColombiaCongo, Dem. Rep.Congo, Rep.Costa RicaCote d'IvoireCroatiaCyprusCzech RepublicDenmarkDominicaDominican RepublicEgypt, Arab Rep.El SalvadorEquatorial GuineaEstoniaEthiopiaFijiFinlandFranceGambia, TheGeorgiaGermanyGhanaGreeceGrenadaGuatemalaHondurasHong Kong SAR, ChinaHungaryIcelandIndiaIndonesiaIran, Islamic Rep.IraqIrelandItalyJamaicaJapanJordanKazakhstanKenyaKiribatiKorea, Rep.Kyrgyz RepublicLao PDRLatviaLebanonLesothoLiberiaLithuaniaLuxembourgMacao SAR, ChinaMacedonia, FYRMadagascarMalawiMalaysiaMaldivesMaliMaltaMauritiusMexicoMicronesia, Fed. Sts.MoldovaMongoliaMoroccoMozambiqueMyanmarNamibiaNepalNetherlandsNew ZealandNicaraguaNigeriaNorwayOmanPakistanPanamaPapua New GuineaParaguayPeruPhilippinesPolandPortugalRomaniaRussian FederationRwandaSamoaSao Tome and PrincipeSenegalSerbiaSeychellesSierra LeoneSingaporeSlovak RepublicSloveniaSouth AfricaSpainSri LankaSt. Kitts and NevisSt. LuciaSurinameSwazilandSwedenSwitzerlandSyrian Arab RepublicTajikistanTanzaniaThailandTimor-LesteTogoTrinidad and TobagoTunisiaTurkeyUgandaUkraineUnited Arab EmiratesUnited KingdomUnited StatesUruguayVanuatuVenezuela, RBVietnamWest Bank and GazaYemen, Rep.ZambiaZimbabwe Timeline:
This timeline shows a graph from 1991 to 2015 of Italy. No data until 1990. Number of actual observations by date: 25.
Source name:
World Development Indicators
Source organization:
International Monetary Fund, Government Finance Statistics Yearbook and data files, and World Bank and OECD value added estimates.
Categories, topics:
Public Sector
Last updated:
apr 23, 2017
Indicators value changes by year
Maximum:
13.291
jan 1, 1992
At the date of observation
Value
Absolute change
Change from previous value
jan 1, 1991
12.274
+12.274
0.0%
jan 1, 1992
13.291
+1.017
8.29%
jan 1, 1993
13.128
-0.163
-1.23%
jan 1, 1994
12.287
-0.84
-6.4%
jan 1, 1995
12.363
+0.076
0.62%
jan 1, 1996
10.001
-2.362
-19.11%
jan 1, 1997
9.395
-0.606
-6.06%
jan 1, 1998
9.894
+0.499
5.31%
jan 1, 1999
10.602
+0.708
7.15%
jan 1, 2000
10.813
+0.211
1.99%
jan 1, 2001
9.973
-0.84
-7.76%
jan 1, 2002
9.47
-0.503
-5.04%
jan 1, 2003
9.43
-0.04
-0.43%
jan 1, 2004
8.972
-0.458
-4.86%
jan 1, 2005
9.118
+0.146
1.63%
jan 1, 2006
9.161
+0.043
0.47%
jan 1, 2007
9.546
+0.385
4.2%
jan 1, 2008
9.296
-0.25
-2.61%
jan 1, 2009
8.762
-0.534
-5.75%
jan 1, 2010
8.913
+0.151
1.73%
jan 1, 2011
9.521
+0.608
6.82%
jan 1, 2012
9.715
+0.194
2.04%
jan 1, 2013
10.177
+0.462
4.75%
jan 1, 2014
10.087
-0.09
-0.89%
jan 1, 2015
10.43
+0.343
3.4%
Ranking of countries by current statistics by years


Comments: