29
/
en
AIzaSyAYiBZKx7MnpbEhh9jyipgxe19OcubqV5w
April 1, 2024
183367
Macao SAR, China
MAC
true
2
1
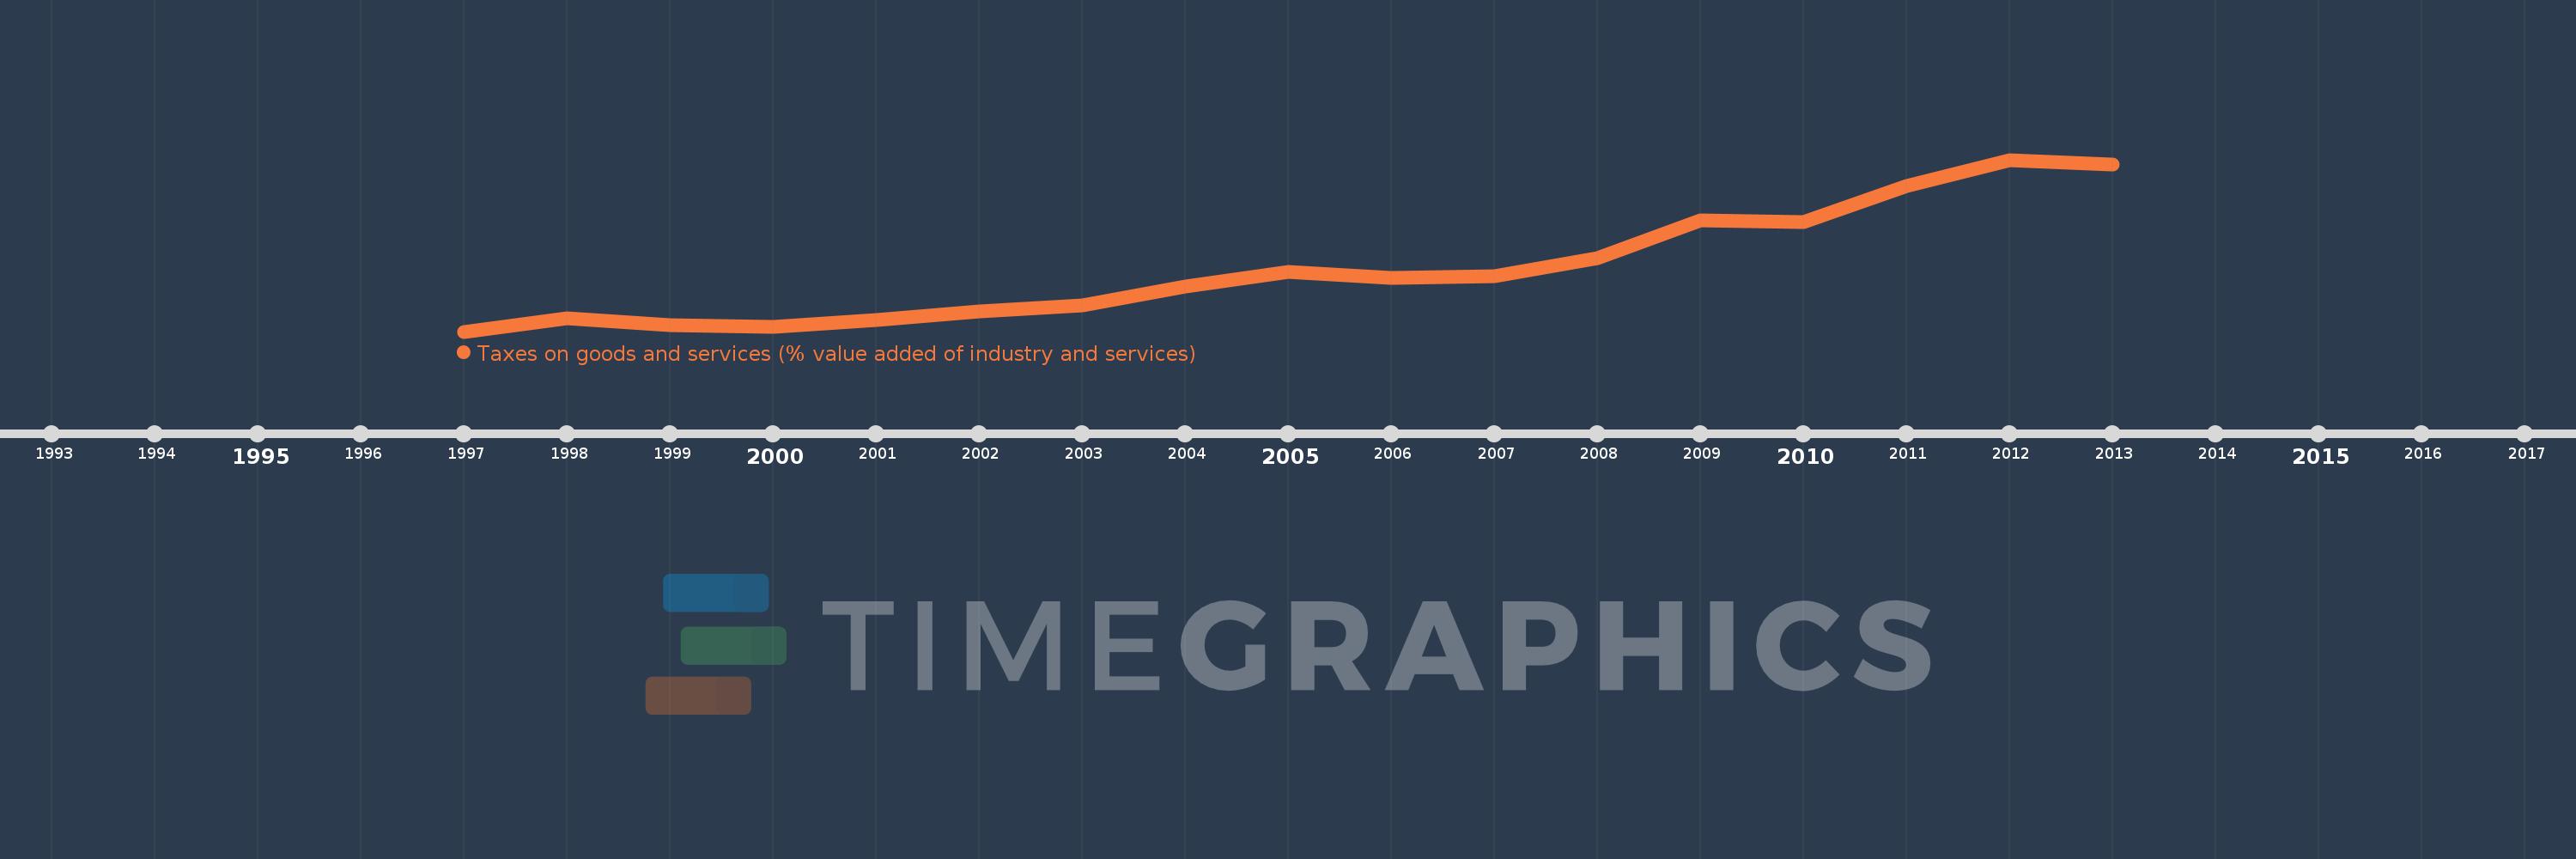
Taxes on goods and services (% value added of industry and services)
2013,2012,2011,2010,2009,2008,2007,2006,2005,2004,2003,2002,2001,2000,1999,1998,1997
This statistics in other country:
AfghanistanAlbaniaAlgeriaAngolaAntigua and BarbudaArgentinaArmeniaAustraliaAustriaAzerbaijanBahrainBangladeshBarbadosBelarusBelgiumBelizeBeninBhutanBoliviaBosnia and HerzegovinaBotswanaBrazilBulgariaBurkina FasoBurundiCabo VerdeCambodiaCanadaCentral African RepublicChileChinaColombiaCongo, Dem. Rep.Congo, Rep.Costa RicaCote d'IvoireCroatiaCyprusCzech RepublicDenmarkDominicaDominican RepublicEgypt, Arab Rep.El SalvadorEquatorial GuineaEstoniaEthiopiaFijiFinlandFranceGambia, TheGeorgiaGermanyGhanaGreeceGrenadaGuatemalaHondurasHong Kong SAR, ChinaHungaryIcelandIndiaIndonesiaIran, Islamic Rep.IraqIrelandItalyJamaicaJapanJordanKazakhstanKenyaKiribatiKorea, Rep.Kyrgyz RepublicLao PDRLatviaLebanonLesothoLiberiaLithuaniaLuxembourgMacao SAR, ChinaMacedonia, FYRMadagascarMalawiMalaysiaMaldivesMaliMaltaMauritiusMexicoMicronesia, Fed. Sts.MoldovaMongoliaMoroccoMozambiqueMyanmarNamibiaNepalNetherlandsNew ZealandNicaraguaNigeriaNorwayOmanPakistanPanamaPapua New GuineaParaguayPeruPhilippinesPolandPortugalRomaniaRussian FederationRwandaSamoaSao Tome and PrincipeSenegalSerbiaSeychellesSierra LeoneSingaporeSlovak RepublicSloveniaSouth AfricaSpainSri LankaSt. Kitts and NevisSt. LuciaSurinameSwazilandSwedenSwitzerlandSyrian Arab RepublicTajikistanTanzaniaThailandTimor-LesteTogoTrinidad and TobagoTunisiaTurkeyUgandaUkraineUnited Arab EmiratesUnited KingdomUnited StatesUruguayVanuatuVenezuela, RBVietnamWest Bank and GazaYemen, Rep.ZambiaZimbabwe Timeline:
This timeline shows a graph from 1997 to 2013 of Macao SAR, China. No data until 1996. Number of actual observations by date: 17.
Source name:
World Development Indicators
Source organization:
International Monetary Fund, Government Finance Statistics Yearbook and data files, and World Bank and OECD value added estimates.
Categories, topics:
Public Sector
Last updated:
apr 23, 2017
Indicators value changes by year
Minimum:
13.361
jan 1, 1997
Maximum:
56.478
jan 1, 2012
At the date of observation
Value
Absolute change
Change from previous value
jan 1, 1997
13.361
+13.361
0.0%
jan 1, 1998
16.73
+3.369
25.22%
jan 1, 1999
14.899
-1.831
-10.94%
jan 1, 2000
14.588
-0.311
-2.09%
jan 1, 2001
16.236
+1.648
11.29%
jan 1, 2002
18.435
+2.2
13.55%
jan 1, 2003
19.983
+1.548
8.4%
jan 1, 2004
24.692
+4.709
23.56%
jan 1, 2005
28.414
+3.722
15.07%
jan 1, 2006
26.924
-1.49
-5.25%
jan 1, 2007
27.284
+0.361
1.34%
jan 1, 2008
31.861
+4.576
16.77%
jan 1, 2009
41.234
+9.374
29.42%
jan 1, 2010
40.838
-0.396
-0.96%
jan 1, 2011
49.844
+9.006
22.05%
jan 1, 2012
56.478
+6.634
13.31%
jan 1, 2013
55.385
-1.093
-1.94%
Ranking of countries by current statistics by years


Comments: