29
/
en
AIzaSyAYiBZKx7MnpbEhh9jyipgxe19OcubqV5w
April 1, 2024
230488
Russian Federation
RUS
true
2
1
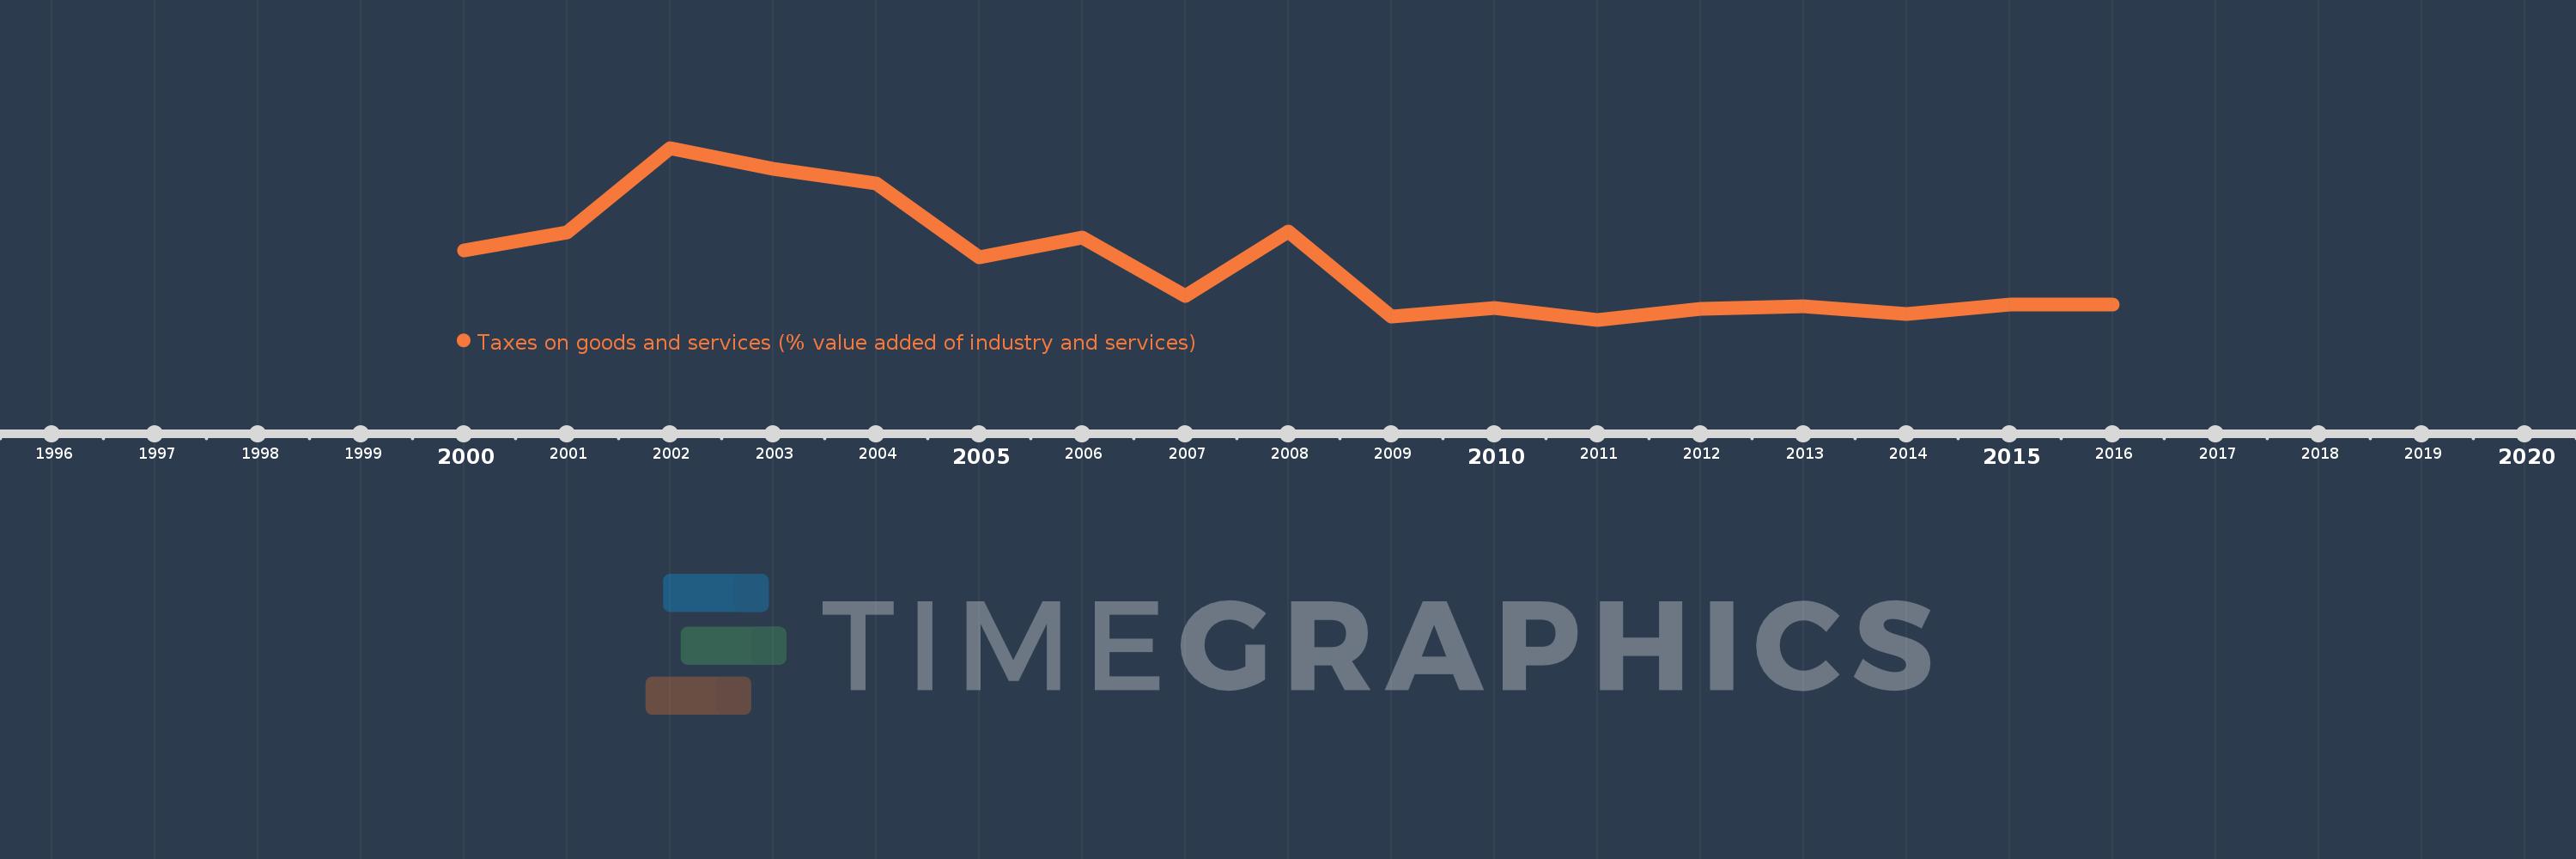
Taxes on goods and services (% value added of industry and services)
2016,2015,2014,2013,2012,2011,2010,2009,2008,2007,2006,2005,2004,2003,2002,2001,2000
This statistics in other country:
AfghanistanAlbaniaAlgeriaAngolaAntigua and BarbudaArgentinaArmeniaAustraliaAustriaAzerbaijanBahrainBangladeshBarbadosBelarusBelgiumBelizeBeninBhutanBoliviaBosnia and HerzegovinaBotswanaBrazilBulgariaBurkina FasoBurundiCabo VerdeCambodiaCanadaCentral African RepublicChileChinaColombiaCongo, Dem. Rep.Congo, Rep.Costa RicaCote d'IvoireCroatiaCyprusCzech RepublicDenmarkDominicaDominican RepublicEgypt, Arab Rep.El SalvadorEquatorial GuineaEstoniaEthiopiaFijiFinlandFranceGambia, TheGeorgiaGermanyGhanaGreeceGrenadaGuatemalaHondurasHong Kong SAR, ChinaHungaryIcelandIndiaIndonesiaIran, Islamic Rep.IraqIrelandItalyJamaicaJapanJordanKazakhstanKenyaKiribatiKorea, Rep.Kyrgyz RepublicLao PDRLatviaLebanonLesothoLiberiaLithuaniaLuxembourgMacao SAR, ChinaMacedonia, FYRMadagascarMalawiMalaysiaMaldivesMaliMaltaMauritiusMexicoMicronesia, Fed. Sts.MoldovaMongoliaMoroccoMozambiqueMyanmarNamibiaNepalNetherlandsNew ZealandNicaraguaNigeriaNorwayOmanPakistanPanamaPapua New GuineaParaguayPeruPhilippinesPolandPortugalRomaniaRussian FederationRwandaSamoaSao Tome and PrincipeSenegalSerbiaSeychellesSierra LeoneSingaporeSlovak RepublicSloveniaSouth AfricaSpainSri LankaSt. Kitts and NevisSt. LuciaSurinameSwazilandSwedenSwitzerlandSyrian Arab RepublicTajikistanTanzaniaThailandTimor-LesteTogoTrinidad and TobagoTunisiaTurkeyUgandaUkraineUnited Arab EmiratesUnited KingdomUnited StatesUruguayVanuatuVenezuela, RBVietnamWest Bank and GazaYemen, Rep.ZambiaZimbabwe Timeline:
This timeline shows a graph from 2000 to 2016 of Russian Federation. No data until 1999. Number of actual observations by date: 17.
Source name:
World Development Indicators
Source organization:
International Monetary Fund, Government Finance Statistics Yearbook and data files, and World Bank and OECD value added estimates.
Categories, topics:
Public Sector
Last updated:
apr 23, 2017
Indicators value changes by year
Maximum:
11.419
jan 1, 2002
At the date of observation
Value
Absolute change
Change from previous value
jan 1, 2000
8.644
+8.644
0.0%
jan 1, 2001
9.136
+0.492
5.7%
jan 1, 2002
11.419
+2.283
24.99%
jan 1, 2003
10.846
-0.572
-5.01%
jan 1, 2004
10.456
-0.39
-3.6%
jan 1, 2005
8.473
-1.983
-18.96%
jan 1, 2006
9.007
+0.533
6.3%
jan 1, 2007
7.426
-1.581
-17.55%
jan 1, 2008
9.172
+1.746
23.51%
jan 1, 2009
6.87
-2.302
-25.1%
jan 1, 2010
7.098
+0.229
3.33%
jan 1, 2011
6.786
-0.313
-4.4%
jan 1, 2012
7.069
+0.284
4.18%
jan 1, 2013
7.144
+0.074
1.05%
jan 1, 2014
6.952
-0.192
-2.69%
jan 1, 2015
7.191
+0.24
3.45%
jan 1, 2016
7.202
+0.01
0.14%
Ranking of countries by current statistics by years


Comments: