30
/
AIzaSyAYiBZKx7MnpbEhh9jyipgxe19OcubqV5w
April 1, 2024
81783
Belgium
BEL
true
2
1
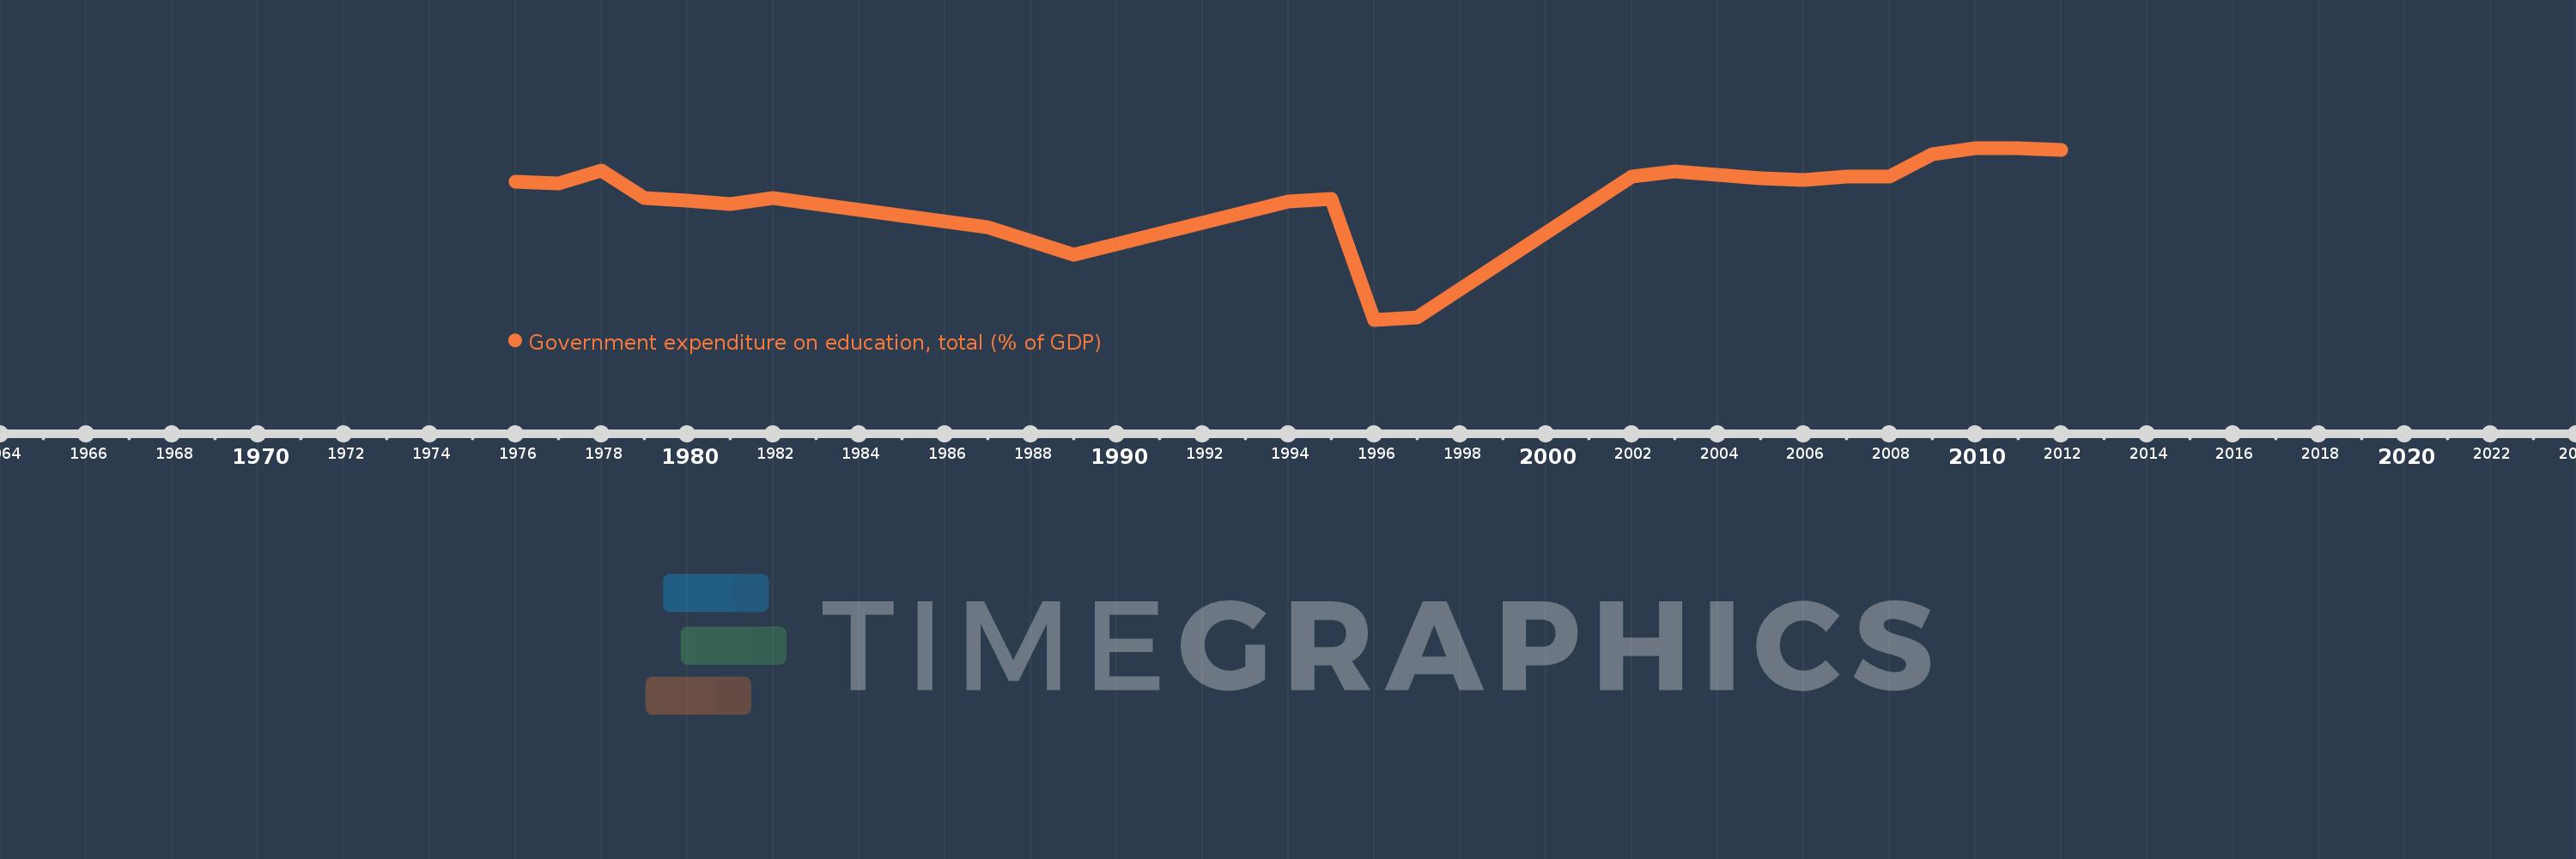
Government expenditure on education, total (% of GDP)
2012,2011,2010,2009,2008,2007,2006,2005,2004,2003,2002,1997,1996,1995,1994,1989,1988,1987,1983,1982,1981,1980,1979,1978,1977,1976
