29
/
en
AIzaSyAYiBZKx7MnpbEhh9jyipgxe19OcubqV5w
April 1, 2024
159446
Ireland
IRL
true
2
1
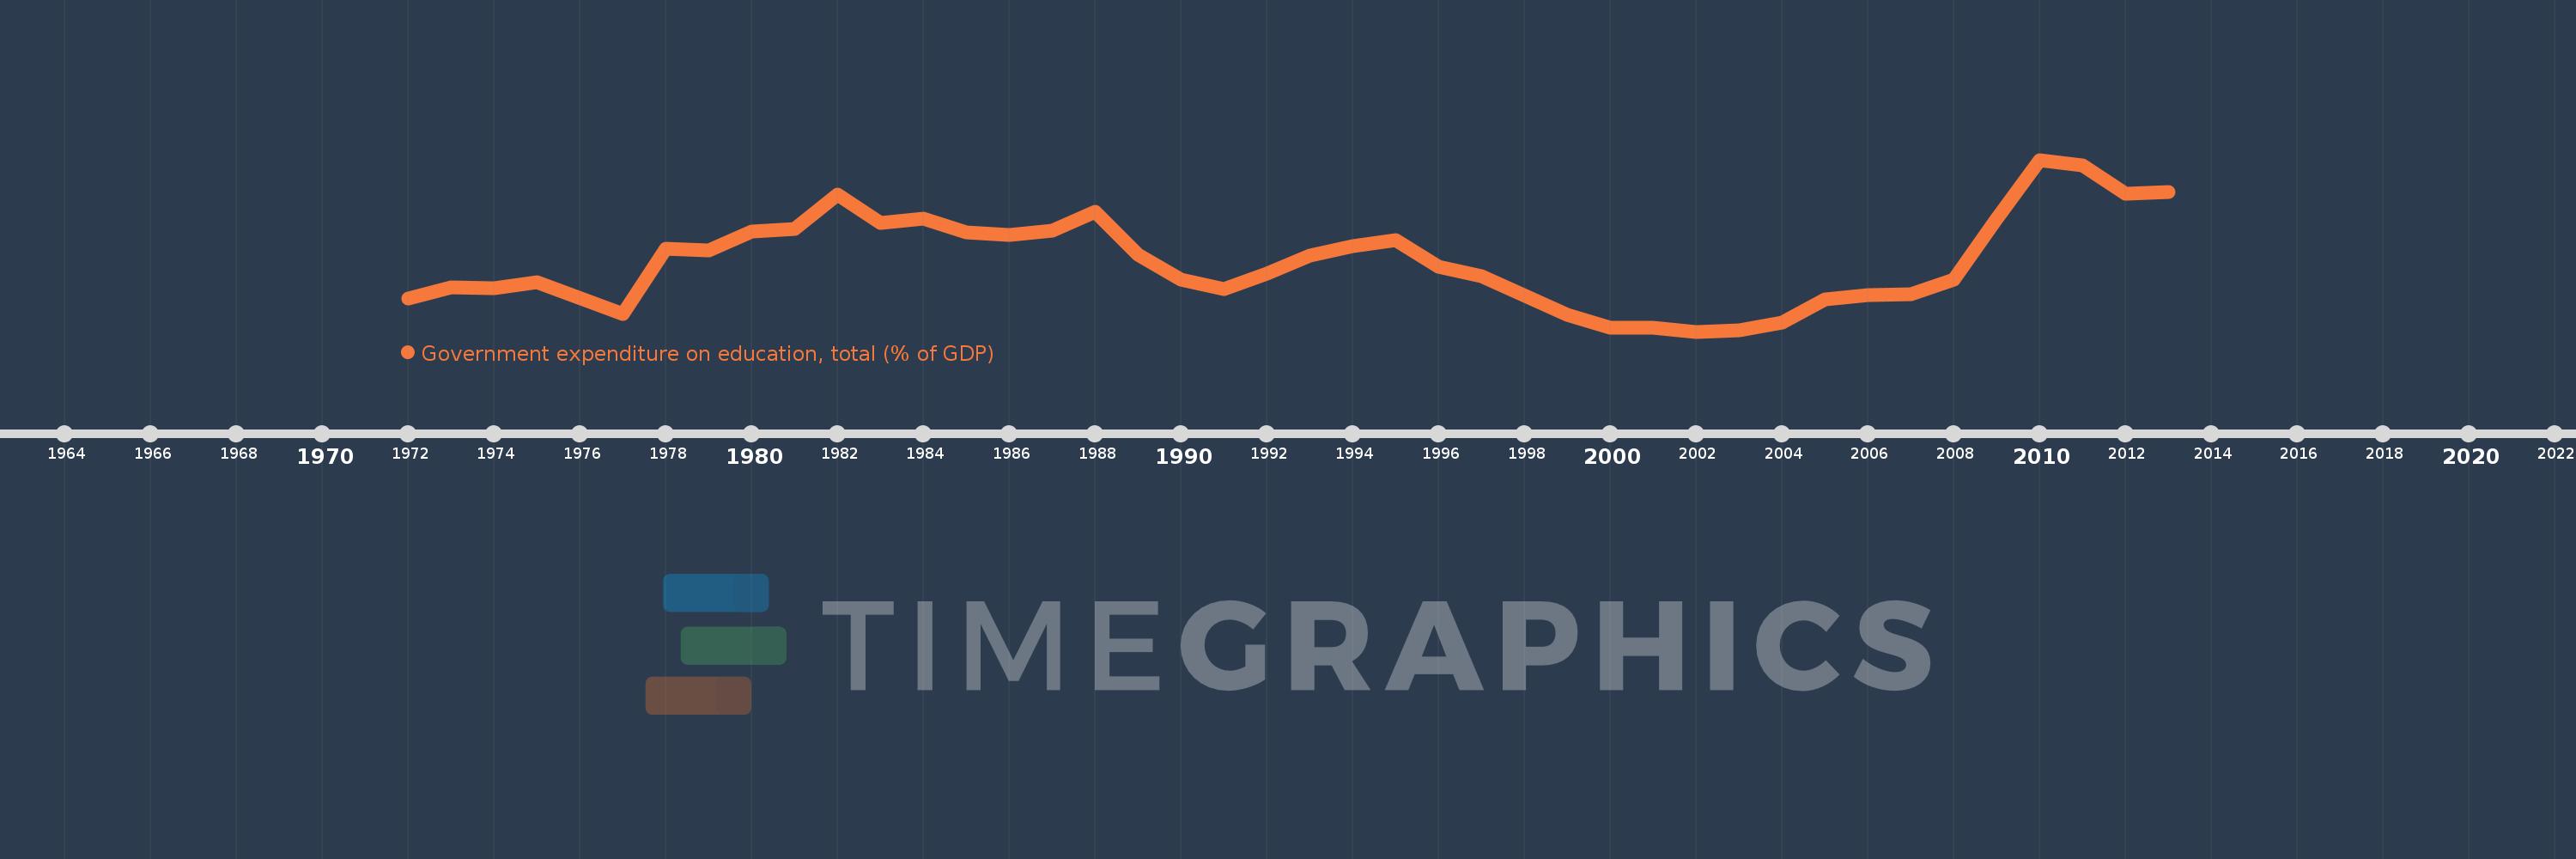
Government expenditure on education, total (% of GDP)
2013,2012,2011,2010,2009,2008,2007,2006,2005,2004,2003,2002,2001,2000,1999,1997,1996,1995,1994,1993,1992,1991,1990,1989,1988,1987,1986,1985,1984,1983,1982,1981,1980,1979,1978,1977,1975,1974,1973,1972
This statistics in other country:
AfghanistanAlbaniaAlgeriaAndorraAngolaAntigua and BarbudaArab WorldArgentinaArmeniaArubaAustraliaAustriaAzerbaijanBahamas, TheBahrainBangladeshBarbadosBelarusBelgiumBelizeBeninBermudaBhutanBoliviaBotswanaBrazilBritish Virgin IslandsBrunei DarussalamBulgariaBurkina FasoBurundiCabo VerdeCambodiaCameroonCanadaCaribbean small statesCentral African RepublicCentral Europe and the BalticsChadChileChinaColombiaComorosCongo, Dem. Rep.Congo, Rep.Costa RicaCote d'IvoireCroatiaCubaCuracaoCyprusCzech RepublicDenmarkDjiboutiDominicaDominican RepublicEarly-demographic dividendEast Asia & PacificEast Asia & Pacific (excluding high income)East Asia & Pacific (IDA & IBRD countries)EcuadorEgypt, Arab Rep.El SalvadorEquatorial GuineaEritreaEstoniaEthiopiaEuro areaEurope & Central AsiaEurope & Central Asia (excluding high income)Europe & Central Asia (IDA & IBRD countries)European UnionFijiFinlandFranceGabonGambia, TheGeorgiaGermanyGhanaGreeceGrenadaGuatemalaGuineaGuinea-BissauGuyanaHaitiHeavily indebted poor countries (HIPC)High incomeHondurasHong Kong SAR, ChinaHungaryIBRD onlyIcelandIDA & IBRD totalIDA blendIDA onlyIDA totalIndiaIndonesiaIran, Islamic Rep.IraqIrelandIsraelItalyJamaicaJapanJordanKazakhstanKenyaKiribatiKorea, Rep.KuwaitKyrgyz RepublicLao PDRLate-demographic dividendLatin America & Caribbean Latin America & Caribbean (excluding high income)Latin America & the Caribbean (IDA & IBRD countries)LatviaLeast developed countries: UN classificationLebanonLesothoLiberiaLibyaLiechtensteinLithuaniaLow & middle incomeLow incomeLower middle incomeLuxembourgMacao SAR, ChinaMacedonia, FYRMadagascarMalawiMalaysiaMaldivesMaliMaltaMarshall IslandsMauritaniaMauritiusMexicoMicronesia, Fed. Sts.Middle East & North AfricaMiddle East & North Africa (excluding high income)Middle East & North Africa (IDA & IBRD countries)Middle incomeMoldovaMonacoMongoliaMoroccoMozambiqueMyanmarNamibiaNepalNetherlandsNew ZealandNicaraguaNigerNigeriaNorth AmericaNorwayOECD membersOmanOther small statesPakistanPalauPanamaPapua New GuineaParaguayPeruPhilippinesPolandPortugalPost-demographic dividendPre-demographic dividendPuerto RicoQatarRomaniaRussian FederationRwandaSamoaSan MarinoSao Tome and PrincipeSaudi ArabiaSenegalSerbiaSeychellesSierra LeoneSingaporeSlovak RepublicSloveniaSmall statesSolomon IslandsSomaliaSouth AfricaSouth AsiaSouth Asia (IDA & IBRD)South SudanSpainSri LankaSt. Kitts and NevisSt. LuciaSt. Vincent and the GrenadinesSub-Saharan Africa Sub-Saharan Africa (excluding high income)Sub-Saharan Africa (IDA & IBRD countries)SudanSwazilandSwedenSwitzerlandSyrian Arab RepublicTajikistanTanzaniaThailandTimor-LesteTogoTongaTrinidad and TobagoTunisiaTurkeyTurkmenistanTurks and Caicos IslandsTuvaluUgandaUkraineUnited Arab EmiratesUnited KingdomUnited StatesUpper middle incomeUruguayVanuatuVenezuela, RBVietnamWorldYemen, Rep.ZambiaZimbabwe Timeline:
This timeline shows a graph from 1972 to 2013 of Ireland. No data until 1971. Number of actual observations by date: 40.
Source name:
World Development Indicators
Source organization:
United Nations Educational, Scientific, and Cultural Organization (UNESCO) Institute for Statistics.
Categories, topics:
Education
Last updated:
apr 23, 2017
Indicators value changes by year
At the date of observation
Value
Absolute change
Change from previous value
jan 1, 1972
4.491
+4.491
0.0%
jan 1, 1973
4.622
+0.131
2.91%
jan 1, 1974
4.613
-0.008
-0.18%
jan 1, 1975
4.691
+0.078
1.68%
jan 1, 1977
4.301
-0.39
-8.31%
jan 1, 1978
5.09
+0.79
18.36%
jan 1, 1979
5.073
-0.018
-0.35%
jan 1, 1980
5.293
+0.221
4.35%
jan 1, 1981
5.328
+0.034
0.64%
jan 1, 1982
5.738
+0.41
7.7%
jan 1, 1983
5.395
-0.343
-5.97%
jan 1, 1984
5.452
+0.057
1.06%
jan 1, 1985
5.287
-0.165
-3.03%
jan 1, 1986
5.254
-0.033
-0.63%
jan 1, 1987
5.307
+0.053
1.01%
jan 1, 1988
5.534
+0.228
4.29%
jan 1, 1989
5.021
-0.513
-9.27%
jan 1, 1990
4.718
-0.303
-6.04%
jan 1, 1991
4.605
-0.113
-2.39%
jan 1, 1992
4.787
+0.182
3.96%
jan 1, 1993
5.011
+0.223
4.66%
jan 1, 1994
5.121
+0.11
2.2%
jan 1, 1995
5.194
+0.073
1.43%
jan 1, 1996
4.876
-0.317
-6.11%
jan 1, 1997
4.76
-0.117
-2.39%
jan 1, 1999
4.293
-0.466
-9.8%
jan 1, 2000
4.141
-0.152
-3.55%
jan 1, 2001
4.137
-0.004
-0.09%
jan 1, 2002
4.094
-0.043
-1.05%
jan 1, 2003
4.106
+0.012
0.3%
jan 1, 2004
4.199
+0.093
2.26%
jan 1, 2005
4.485
+0.286
6.82%
jan 1, 2006
4.528
+0.042
0.94%
jan 1, 2007
4.547
+0.02
0.43%
jan 1, 2008
4.716
+0.169
3.71%
jan 1, 2009
5.451
+0.735
15.58%
jan 1, 2010
6.159
+0.709
13.0%
jan 1, 2011
6.095
-0.064
-1.04%
jan 1, 2012
5.753
-0.342
-5.61%
jan 1, 2013
5.775
+0.021
0.37%
Ranking of countries by current statistics by years


Comments: