29
/
en
AIzaSyAYiBZKx7MnpbEhh9jyipgxe19OcubqV5w
April 1, 2024
207975
Netherlands
NLD
true
2
1
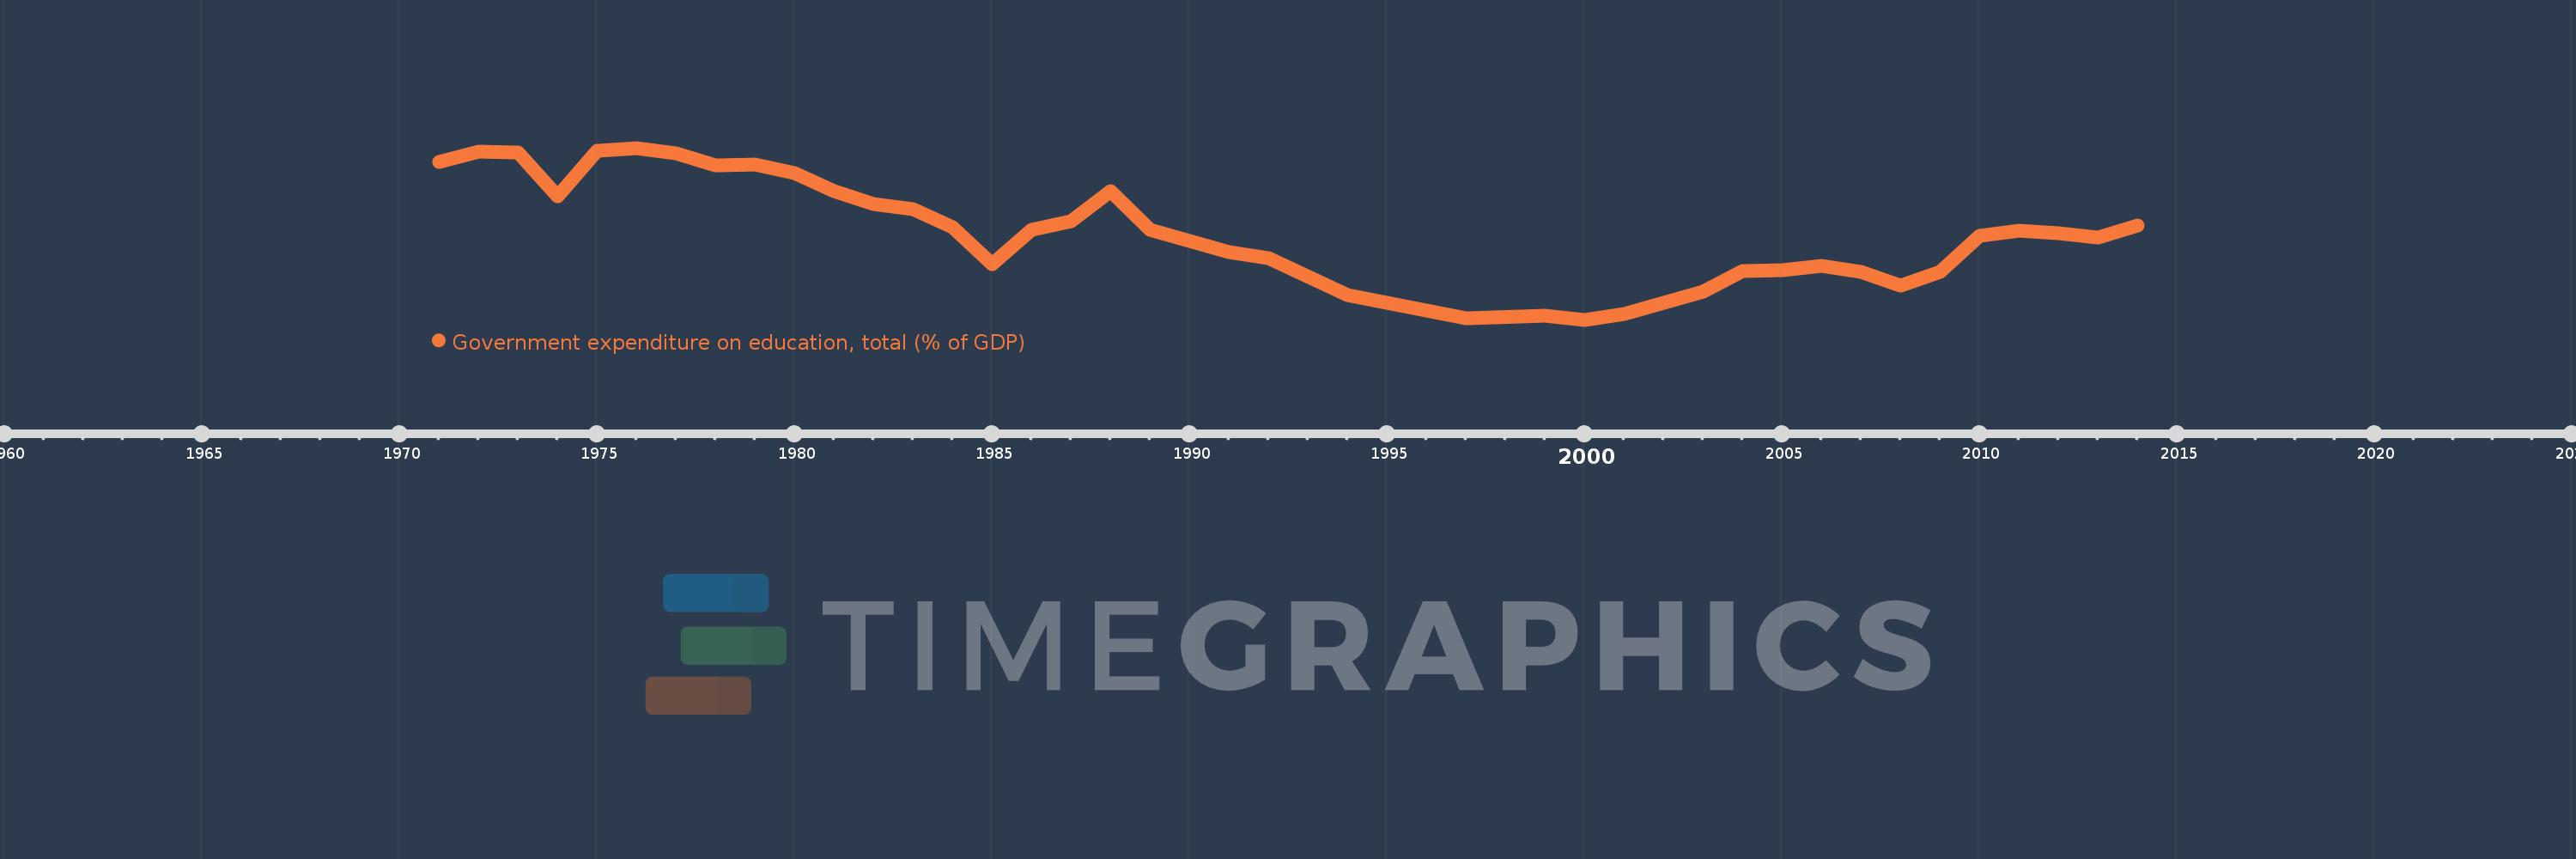
Government expenditure on education, total (% of GDP)
2014,2013,2012,2011,2010,2009,2008,2007,2006,2005,2004,2003,2002,2001,2000,1999,1997,1996,1995,1994,1992,1991,1989,1988,1987,1986,1985,1984,1983,1982,1981,1980,1979,1978,1977,1976,1975,1974,1973,1972,1971
This statistics in other country:
AfghanistanAlbaniaAlgeriaAndorraAngolaAntigua and BarbudaArab WorldArgentinaArmeniaArubaAustraliaAustriaAzerbaijanBahamas, TheBahrainBangladeshBarbadosBelarusBelgiumBelizeBeninBermudaBhutanBoliviaBotswanaBrazilBritish Virgin IslandsBrunei DarussalamBulgariaBurkina FasoBurundiCabo VerdeCambodiaCameroonCanadaCaribbean small statesCentral African RepublicCentral Europe and the BalticsChadChileChinaColombiaComorosCongo, Dem. Rep.Congo, Rep.Costa RicaCote d'IvoireCroatiaCubaCuracaoCyprusCzech RepublicDenmarkDjiboutiDominicaDominican RepublicEarly-demographic dividendEast Asia & PacificEast Asia & Pacific (excluding high income)East Asia & Pacific (IDA & IBRD countries)EcuadorEgypt, Arab Rep.El SalvadorEquatorial GuineaEritreaEstoniaEthiopiaEuro areaEurope & Central AsiaEurope & Central Asia (excluding high income)Europe & Central Asia (IDA & IBRD countries)European UnionFijiFinlandFranceGabonGambia, TheGeorgiaGermanyGhanaGreeceGrenadaGuatemalaGuineaGuinea-BissauGuyanaHaitiHeavily indebted poor countries (HIPC)High incomeHondurasHong Kong SAR, ChinaHungaryIBRD onlyIcelandIDA & IBRD totalIDA blendIDA onlyIDA totalIndiaIndonesiaIran, Islamic Rep.IraqIrelandIsraelItalyJamaicaJapanJordanKazakhstanKenyaKiribatiKorea, Rep.KuwaitKyrgyz RepublicLao PDRLate-demographic dividendLatin America & Caribbean Latin America & Caribbean (excluding high income)Latin America & the Caribbean (IDA & IBRD countries)LatviaLeast developed countries: UN classificationLebanonLesothoLiberiaLibyaLiechtensteinLithuaniaLow & middle incomeLow incomeLower middle incomeLuxembourgMacao SAR, ChinaMacedonia, FYRMadagascarMalawiMalaysiaMaldivesMaliMaltaMarshall IslandsMauritaniaMauritiusMexicoMicronesia, Fed. Sts.Middle East & North AfricaMiddle East & North Africa (excluding high income)Middle East & North Africa (IDA & IBRD countries)Middle incomeMoldovaMonacoMongoliaMoroccoMozambiqueMyanmarNamibiaNepalNetherlandsNew ZealandNicaraguaNigerNigeriaNorth AmericaNorwayOECD membersOmanOther small statesPakistanPalauPanamaPapua New GuineaParaguayPeruPhilippinesPolandPortugalPost-demographic dividendPre-demographic dividendPuerto RicoQatarRomaniaRussian FederationRwandaSamoaSan MarinoSao Tome and PrincipeSaudi ArabiaSenegalSerbiaSeychellesSierra LeoneSingaporeSlovak RepublicSloveniaSmall statesSolomon IslandsSomaliaSouth AfricaSouth AsiaSouth Asia (IDA & IBRD)South SudanSpainSri LankaSt. Kitts and NevisSt. LuciaSt. Vincent and the GrenadinesSub-Saharan Africa Sub-Saharan Africa (excluding high income)Sub-Saharan Africa (IDA & IBRD countries)SudanSwazilandSwedenSwitzerlandSyrian Arab RepublicTajikistanTanzaniaThailandTimor-LesteTogoTongaTrinidad and TobagoTunisiaTurkeyTurkmenistanTurks and Caicos IslandsTuvaluUgandaUkraineUnited Arab EmiratesUnited KingdomUnited StatesUpper middle incomeUruguayVanuatuVenezuela, RBVietnamWorldYemen, Rep.ZambiaZimbabwe Timeline:
This timeline shows a graph from 1971 to 2014 of Netherlands. No data until 1970. Number of actual observations by date: 41.
Source name:
World Development Indicators
Source organization:
United Nations Educational, Scientific, and Cultural Organization (UNESCO) Institute for Statistics.
Categories, topics:
Education
Last updated:
apr 23, 2017
Indicators value changes by year
At the date of observation
Value
Absolute change
Change from previous value
jan 1, 1971
6.326
+6.326
0.0%
jan 1, 1972
6.435
+0.109
1.72%
jan 1, 1973
6.425
-0.01
-0.15%
jan 1, 1974
5.942
-0.484
-7.53%
jan 1, 1975
6.443
+0.501
8.44%
jan 1, 1976
6.479
+0.036
0.56%
jan 1, 1977
6.419
-0.06
-0.93%
jan 1, 1978
6.287
-0.132
-2.06%
jan 1, 1979
6.289
+0.002
0.03%
jan 1, 1980
6.193
-0.096
-1.52%
jan 1, 1981
5.992
-0.201
-3.24%
jan 1, 1982
5.847
-0.146
-2.43%
jan 1, 1983
5.791
-0.055
-0.95%
jan 1, 1984
5.594
-0.197
-3.41%
jan 1, 1985
5.176
-0.418
-7.47%
jan 1, 1986
5.565
+0.389
7.52%
jan 1, 1987
5.656
+0.09
1.62%
jan 1, 1988
5.998
+0.342
6.05%
jan 1, 1989
5.564
-0.434
-7.23%
jan 1, 1991
5.317
-0.247
-4.44%
jan 1, 1992
5.249
-0.068
-1.28%
jan 1, 1994
4.837
-0.412
-7.85%
jan 1, 1995
4.742
-0.095
-1.96%
jan 1, 1996
4.656
-0.086
-1.81%
jan 1, 1997
4.574
-0.082
-1.76%
jan 1, 1999
4.599
+0.024
0.53%
jan 1, 2000
4.557
-0.041
-0.9%
jan 1, 2001
4.626
+0.068
1.5%
jan 1, 2002
4.751
+0.125
2.71%
jan 1, 2003
4.87
+0.12
2.52%
jan 1, 2004
5.101
+0.231
4.75%
jan 1, 2005
5.115
+0.013
0.26%
jan 1, 2006
5.159
+0.044
0.86%
jan 1, 2007
5.09
-0.068
-1.32%
jan 1, 2008
4.934
-0.157
-3.08%
jan 1, 2009
5.092
+0.159
3.21%
jan 1, 2010
5.496
+0.404
7.92%
jan 1, 2011
5.556
+0.06
1.09%
jan 1, 2012
5.526
-0.03
-0.53%
jan 1, 2013
5.476
-0.051
-0.91%
jan 1, 2014
5.608
+0.132
2.42%
Ranking of countries by current statistics by years


Comments: