29
/
en
AIzaSyAYiBZKx7MnpbEhh9jyipgxe19OcubqV5w
April 1, 2024
285933
Zambia
ZMB
true
2
1
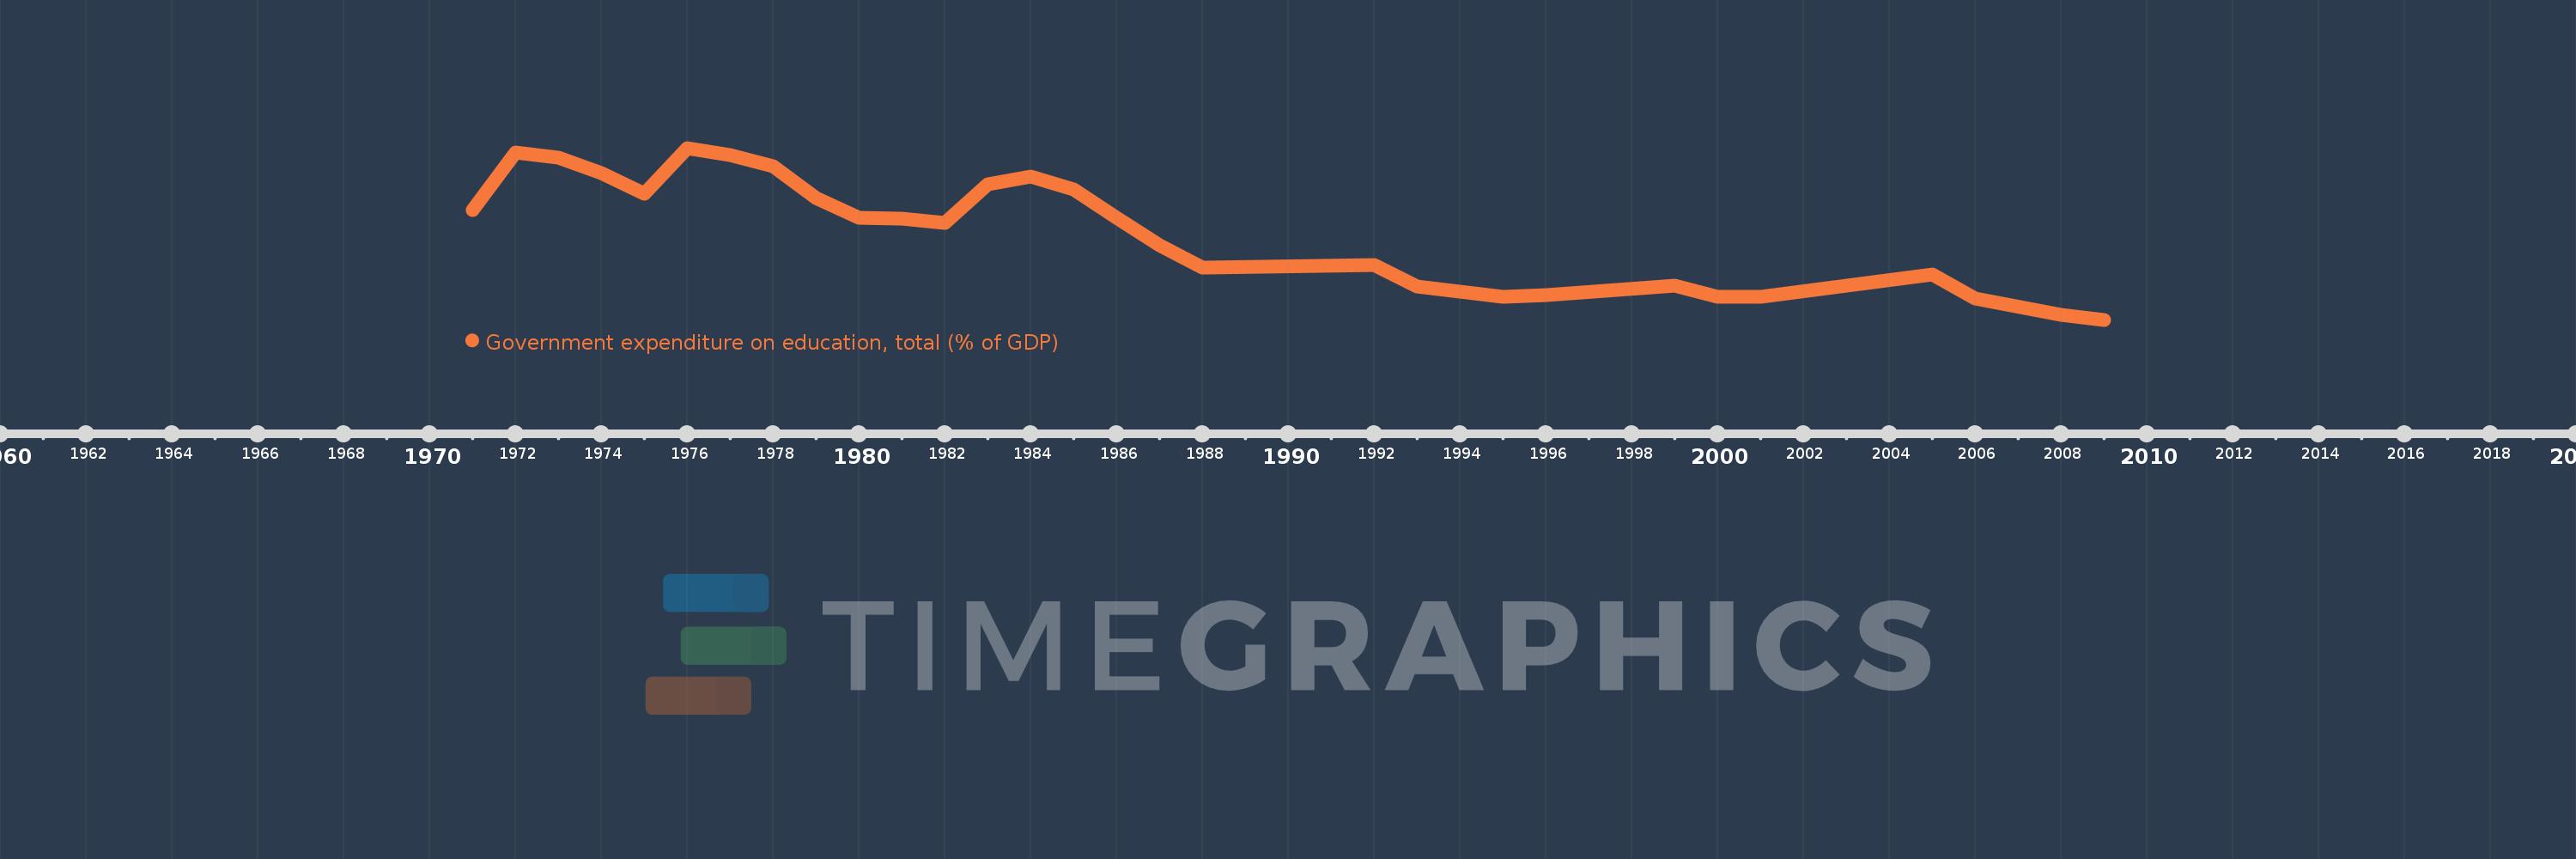
Government expenditure on education, total (% of GDP)
2009,2008,2006,2005,2001,2000,1999,1996,1995,1994,1993,1992,1988,1987,1986,1985,1984,1983,1982,1981,1980,1979,1978,1977,1976,1975,1974,1973,1972,1971
This statistics in other country:
AfghanistanAlbaniaAlgeriaAndorraAngolaAntigua and BarbudaArab WorldArgentinaArmeniaArubaAustraliaAustriaAzerbaijanBahamas, TheBahrainBangladeshBarbadosBelarusBelgiumBelizeBeninBermudaBhutanBoliviaBotswanaBrazilBritish Virgin IslandsBrunei DarussalamBulgariaBurkina FasoBurundiCabo VerdeCambodiaCameroonCanadaCaribbean small statesCentral African RepublicCentral Europe and the BalticsChadChileChinaColombiaComorosCongo, Dem. Rep.Congo, Rep.Costa RicaCote d'IvoireCroatiaCubaCuracaoCyprusCzech RepublicDenmarkDjiboutiDominicaDominican RepublicEarly-demographic dividendEast Asia & PacificEast Asia & Pacific (excluding high income)East Asia & Pacific (IDA & IBRD countries)EcuadorEgypt, Arab Rep.El SalvadorEquatorial GuineaEritreaEstoniaEthiopiaEuro areaEurope & Central AsiaEurope & Central Asia (excluding high income)Europe & Central Asia (IDA & IBRD countries)European UnionFijiFinlandFranceGabonGambia, TheGeorgiaGermanyGhanaGreeceGrenadaGuatemalaGuineaGuinea-BissauGuyanaHaitiHeavily indebted poor countries (HIPC)High incomeHondurasHong Kong SAR, ChinaHungaryIBRD onlyIcelandIDA & IBRD totalIDA blendIDA onlyIDA totalIndiaIndonesiaIran, Islamic Rep.IraqIrelandIsraelItalyJamaicaJapanJordanKazakhstanKenyaKiribatiKorea, Rep.KuwaitKyrgyz RepublicLao PDRLate-demographic dividendLatin America & Caribbean Latin America & Caribbean (excluding high income)Latin America & the Caribbean (IDA & IBRD countries)LatviaLeast developed countries: UN classificationLebanonLesothoLiberiaLibyaLiechtensteinLithuaniaLow & middle incomeLow incomeLower middle incomeLuxembourgMacao SAR, ChinaMacedonia, FYRMadagascarMalawiMalaysiaMaldivesMaliMaltaMarshall IslandsMauritaniaMauritiusMexicoMicronesia, Fed. Sts.Middle East & North AfricaMiddle East & North Africa (excluding high income)Middle East & North Africa (IDA & IBRD countries)Middle incomeMoldovaMonacoMongoliaMoroccoMozambiqueMyanmarNamibiaNepalNetherlandsNew ZealandNicaraguaNigerNigeriaNorth AmericaNorwayOECD membersOmanOther small statesPakistanPalauPanamaPapua New GuineaParaguayPeruPhilippinesPolandPortugalPost-demographic dividendPre-demographic dividendPuerto RicoQatarRomaniaRussian FederationRwandaSamoaSan MarinoSao Tome and PrincipeSaudi ArabiaSenegalSerbiaSeychellesSierra LeoneSingaporeSlovak RepublicSloveniaSmall statesSolomon IslandsSomaliaSouth AfricaSouth AsiaSouth Asia (IDA & IBRD)South SudanSpainSri LankaSt. Kitts and NevisSt. LuciaSt. Vincent and the GrenadinesSub-Saharan Africa Sub-Saharan Africa (excluding high income)Sub-Saharan Africa (IDA & IBRD countries)SudanSwazilandSwedenSwitzerlandSyrian Arab RepublicTajikistanTanzaniaThailandTimor-LesteTogoTongaTrinidad and TobagoTunisiaTurkeyTurkmenistanTurks and Caicos IslandsTuvaluUgandaUkraineUnited Arab EmiratesUnited KingdomUnited StatesUpper middle incomeUruguayVanuatuVenezuela, RBVietnamWorldYemen, Rep.ZambiaZimbabwe Timeline:
This timeline shows a graph from 1971 to 2009 of Zambia. No data until 1970. Number of actual observations by date: 30.
Source name:
World Development Indicators
Source organization:
United Nations Educational, Scientific, and Cultural Organization (UNESCO) Institute for Statistics.
Categories, topics:
Education
Last updated:
apr 23, 2017
Indicators value changes by year
At the date of observation
Value
Absolute change
Change from previous value
jan 1, 1971
4.388
+4.388
0.0%
jan 1, 1972
6.095
+1.708
38.92%
jan 1, 1973
5.946
-0.15
-2.45%
jan 1, 1974
5.488
-0.458
-7.7%
jan 1, 1975
4.878
-0.61
-11.12%
jan 1, 1976
6.239
+1.361
27.89%
jan 1, 1977
6.027
-0.212
-3.39%
jan 1, 1978
5.693
-0.334
-5.55%
jan 1, 1979
4.741
-0.952
-16.72%
jan 1, 1980
4.155
-0.586
-12.36%
jan 1, 1981
4.127
-0.028
-0.68%
jan 1, 1982
4.001
-0.126
-3.05%
jan 1, 1983
5.155
+1.154
28.85%
jan 1, 1984
5.388
+0.233
4.52%
jan 1, 1985
4.989
-0.399
-7.41%
jan 1, 1986
4.146
-0.843
-16.89%
jan 1, 1987
3.339
-0.807
-19.46%
jan 1, 1988
2.662
-0.677
-20.27%
jan 1, 1992
2.741
+0.078
2.94%
jan 1, 1993
2.092
-0.649
-23.68%
jan 1, 1994
1.942
-0.15
-7.15%
jan 1, 1995
1.794
-0.149
-7.65%
jan 1, 1996
1.839
+0.045
2.51%
jan 1, 1999
2.118
+0.28
15.21%
jan 1, 2000
1.775
-0.343
-16.21%
jan 1, 2001
1.788
+0.013
0.75%
jan 1, 2005
2.463
+0.675
37.76%
jan 1, 2006
1.736
-0.728
-29.55%
jan 1, 2008
1.241
-0.495
-28.51%
jan 1, 2009
1.1
-0.141
-11.37%
Ranking of countries by current statistics by years


Comments: