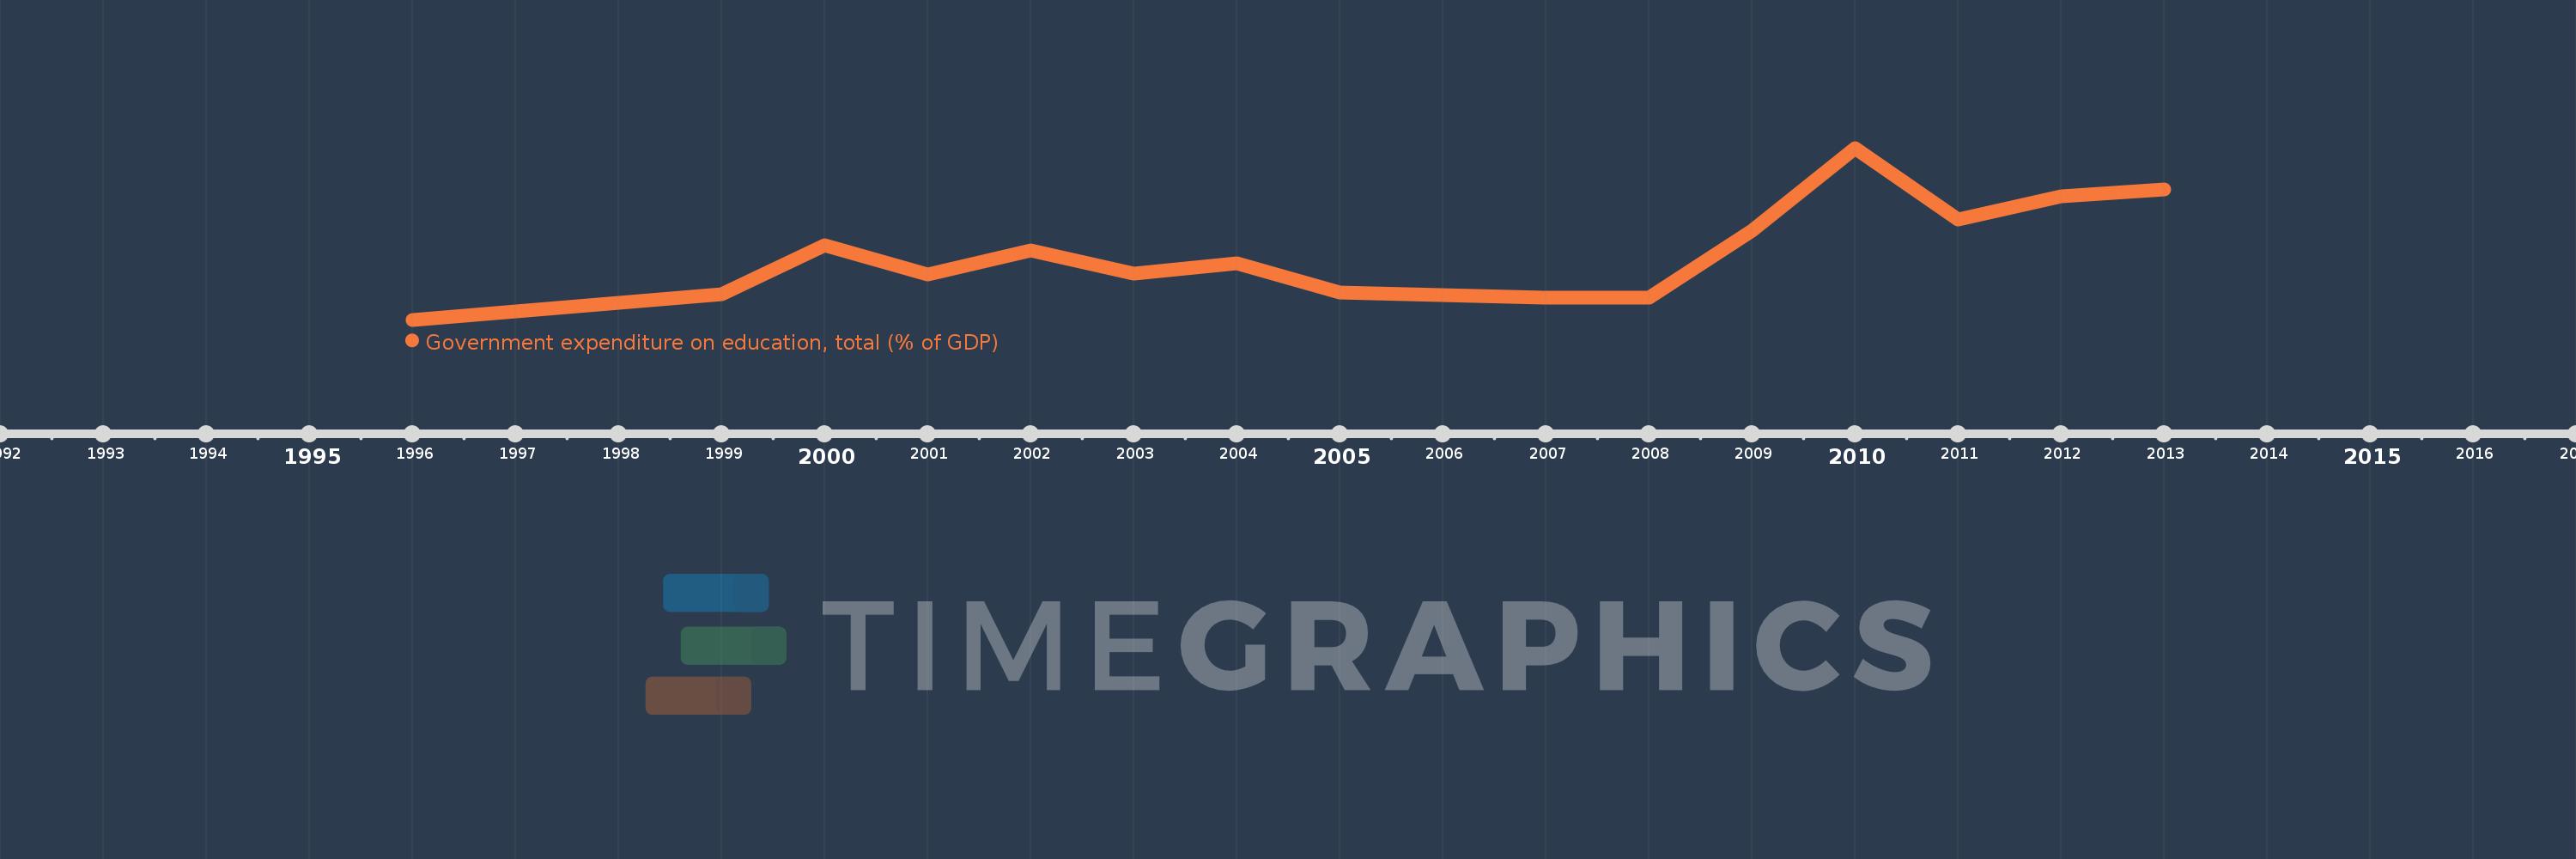
This timeline shows a graph from 1996 to 2013 of Latin America & Caribbean (excluding high income). No data until 1995. Number of actual observations by date: 15.
Source name:
World Development Indicators
Source organization:
United Nations Educational, Scientific, and Cultural Organization (UNESCO) Institute for Statistics.
Categories, topics:
Education
Last updated:
apr 23, 2017
Indicators value changes by year
Meaning:
4.364
Minimum:
3.66
jan 1, 1996
Maximum:
5.472
jan 1, 2010
At the date of observation
Value
Absolute change
Change from the previous value
jan 1, 1996
3.66
+3.66
0.0%
jan 1, 1999
3.926
+0.266
7.27%
jan 1, 2000
4.441
+0.514
13.1%
jan 1, 2001
4.134
-0.307
-6.91%
jan 1, 2002
4.388
+0.254
6.14%
jan 1, 2003
4.143
-0.245
-5.59%
jan 1, 2004
4.257
+0.114
2.75%
jan 1, 2005
3.943
-0.314
-7.38%
jan 1, 2007
3.893
-0.049
-1.25%
jan 1, 2008
3.896
+0.003
0.08%
jan 1, 2009
4.598
+0.702
18.01%
jan 1, 2010
5.472
+0.874
19.0%
jan 1, 2011
4.716
-0.755
-13.8%
jan 1, 2012
4.966
+0.25
5.3%
jan 1, 2013
5.031
+0.065
1.3%
Ranking of countries by current statistics by years
