29
/
en
AIzaSyAYiBZKx7MnpbEhh9jyipgxe19OcubqV5w
April 1, 2024
160524
Israel
ISR
true
2
1
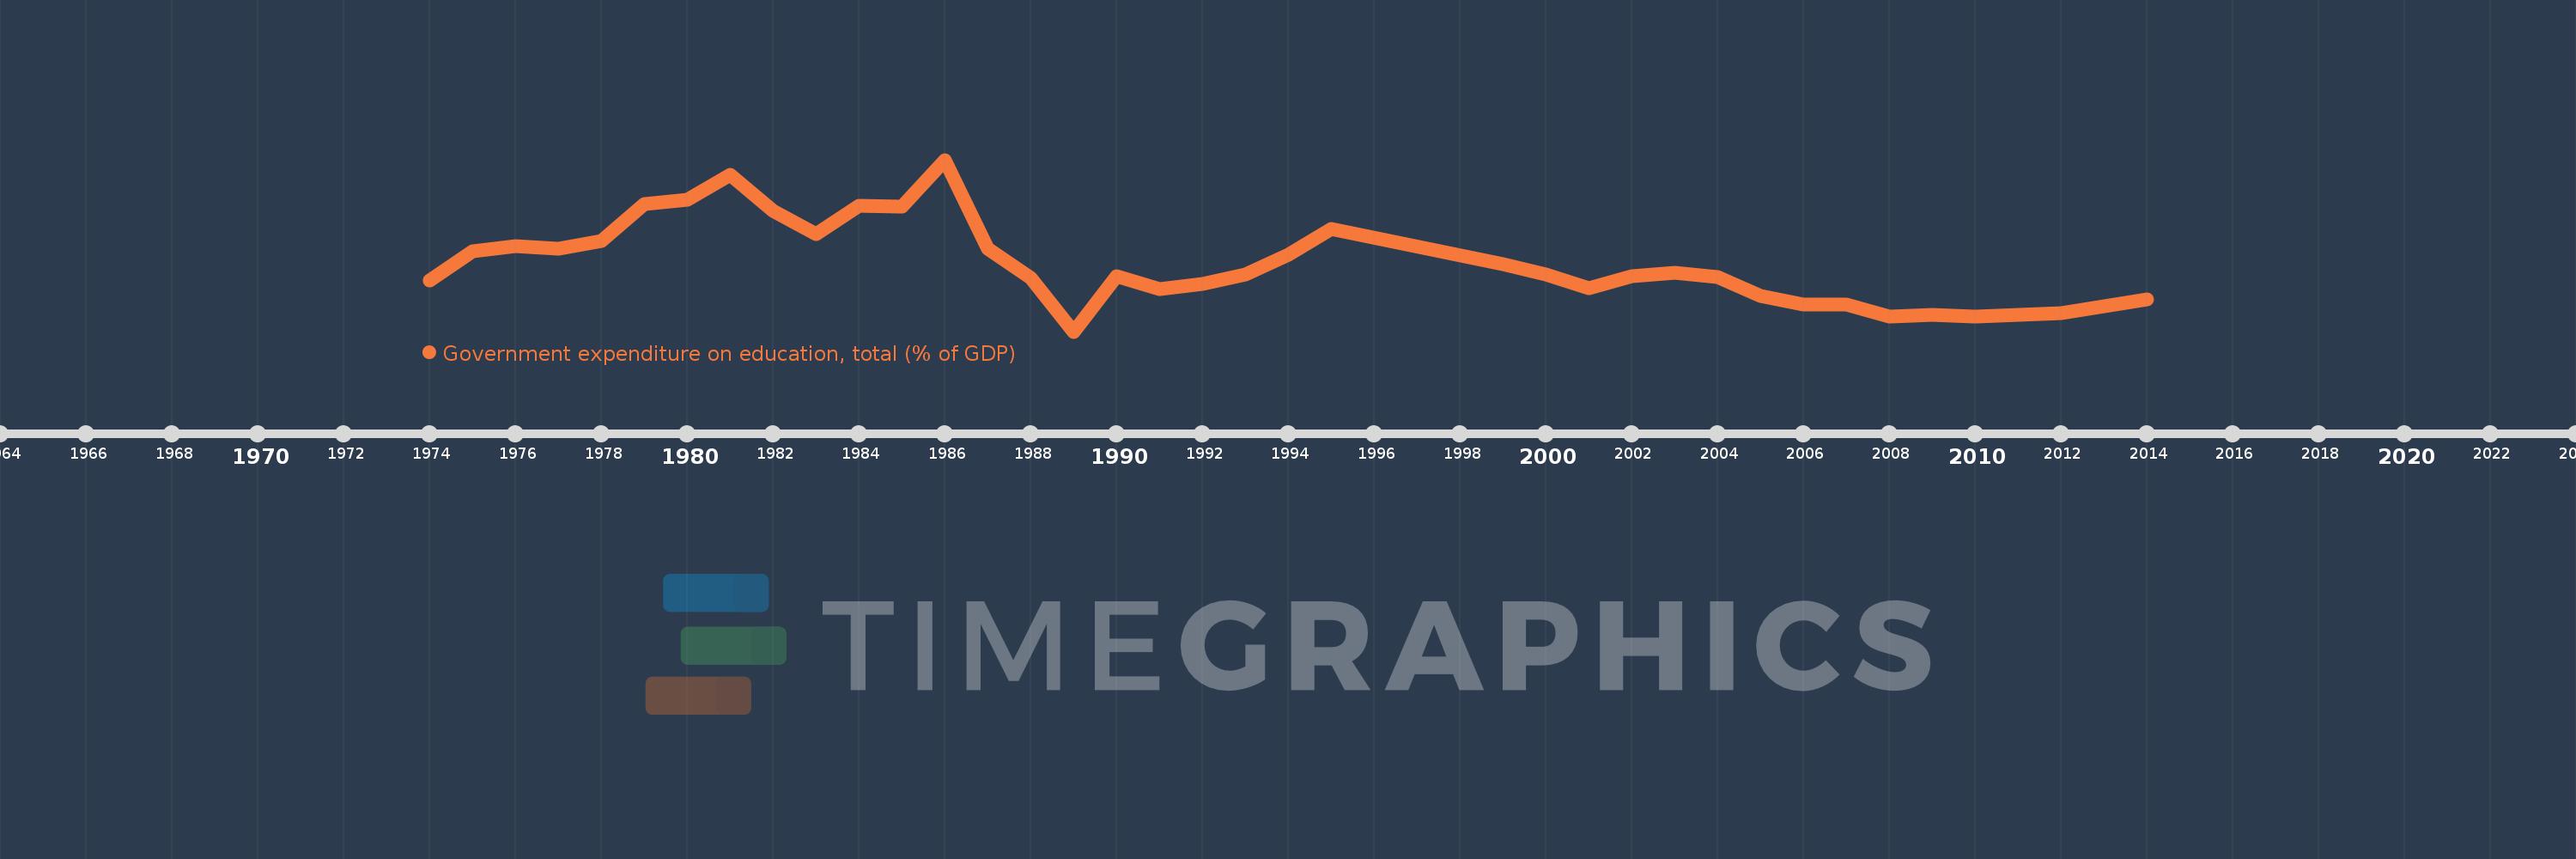
Government expenditure on education, total (% of GDP)
2014,2012,2011,2010,2009,2008,2007,2006,2005,2004,2003,2002,2001,2000,1999,1995,1994,1993,1992,1991,1990,1989,1988,1987,1986,1985,1984,1983,1982,1981,1980,1979,1978,1977,1976,1975,1974
This statistics in other country:
AfghanistanAlbaniaAlgeriaAndorraAngolaAntigua and BarbudaArab WorldArgentinaArmeniaArubaAustraliaAustriaAzerbaijanBahamas, TheBahrainBangladeshBarbadosBelarusBelgiumBelizeBeninBermudaBhutanBoliviaBotswanaBrazilBritish Virgin IslandsBrunei DarussalamBulgariaBurkina FasoBurundiCabo VerdeCambodiaCameroonCanadaCaribbean small statesCentral African RepublicCentral Europe and the BalticsChadChileChinaColombiaComorosCongo, Dem. Rep.Congo, Rep.Costa RicaCote d'IvoireCroatiaCubaCuracaoCyprusCzech RepublicDenmarkDjiboutiDominicaDominican RepublicEarly-demographic dividendEast Asia & PacificEast Asia & Pacific (excluding high income)East Asia & Pacific (IDA & IBRD countries)EcuadorEgypt, Arab Rep.El SalvadorEquatorial GuineaEritreaEstoniaEthiopiaEuro areaEurope & Central AsiaEurope & Central Asia (excluding high income)Europe & Central Asia (IDA & IBRD countries)European UnionFijiFinlandFranceGabonGambia, TheGeorgiaGermanyGhanaGreeceGrenadaGuatemalaGuineaGuinea-BissauGuyanaHaitiHeavily indebted poor countries (HIPC)High incomeHondurasHong Kong SAR, ChinaHungaryIBRD onlyIcelandIDA & IBRD totalIDA blendIDA onlyIDA totalIndiaIndonesiaIran, Islamic Rep.IraqIrelandIsraelItalyJamaicaJapanJordanKazakhstanKenyaKiribatiKorea, Rep.KuwaitKyrgyz RepublicLao PDRLate-demographic dividendLatin America & Caribbean Latin America & Caribbean (excluding high income)Latin America & the Caribbean (IDA & IBRD countries)LatviaLeast developed countries: UN classificationLebanonLesothoLiberiaLibyaLiechtensteinLithuaniaLow & middle incomeLow incomeLower middle incomeLuxembourgMacao SAR, ChinaMacedonia, FYRMadagascarMalawiMalaysiaMaldivesMaliMaltaMarshall IslandsMauritaniaMauritiusMexicoMicronesia, Fed. Sts.Middle East & North AfricaMiddle East & North Africa (excluding high income)Middle East & North Africa (IDA & IBRD countries)Middle incomeMoldovaMonacoMongoliaMoroccoMozambiqueMyanmarNamibiaNepalNetherlandsNew ZealandNicaraguaNigerNigeriaNorth AmericaNorwayOECD membersOmanOther small statesPakistanPalauPanamaPapua New GuineaParaguayPeruPhilippinesPolandPortugalPost-demographic dividendPre-demographic dividendPuerto RicoQatarRomaniaRussian FederationRwandaSamoaSan MarinoSao Tome and PrincipeSaudi ArabiaSenegalSerbiaSeychellesSierra LeoneSingaporeSlovak RepublicSloveniaSmall statesSolomon IslandsSomaliaSouth AfricaSouth AsiaSouth Asia (IDA & IBRD)South SudanSpainSri LankaSt. Kitts and NevisSt. LuciaSt. Vincent and the GrenadinesSub-Saharan Africa Sub-Saharan Africa (excluding high income)Sub-Saharan Africa (IDA & IBRD countries)SudanSwazilandSwedenSwitzerlandSyrian Arab RepublicTajikistanTanzaniaThailandTimor-LesteTogoTongaTrinidad and TobagoTunisiaTurkeyTurkmenistanTurks and Caicos IslandsTuvaluUgandaUkraineUnited Arab EmiratesUnited KingdomUnited StatesUpper middle incomeUruguayVanuatuVenezuela, RBVietnamWorldYemen, Rep.ZambiaZimbabwe Timeline:
This timeline shows a graph from 1974 to 2014 of Israel. No data until 1973. Number of actual observations by date: 37.
Source name:
World Development Indicators
Source organization:
United Nations Educational, Scientific, and Cultural Organization (UNESCO) Institute for Statistics.
Categories, topics:
Education
Last updated:
apr 23, 2017
Indicators value changes by year
At the date of observation
Value
Absolute change
Change from previous value
jan 1, 1974
6.28
+6.28
0.0%
jan 1, 1975
6.939
+0.659
10.49%
jan 1, 1976
7.052
+0.113
1.63%
jan 1, 1977
7.005
-0.046
-0.66%
jan 1, 1978
7.171
+0.166
2.37%
jan 1, 1979
7.99
+0.819
11.42%
jan 1, 1980
8.082
+0.091
1.14%
jan 1, 1981
8.64
+0.558
6.91%
jan 1, 1982
7.831
-0.809
-9.37%
jan 1, 1983
7.328
-0.502
-6.42%
jan 1, 1984
7.954
+0.626
8.54%
jan 1, 1985
7.931
-0.023
-0.29%
jan 1, 1986
8.978
+1.047
13.2%
jan 1, 1987
6.987
-1.991
-22.17%
jan 1, 1988
6.341
-0.647
-9.26%
jan 1, 1989
5.147
-1.194
-18.83%
jan 1, 1990
6.386
+1.239
24.08%
jan 1, 1991
6.097
-0.289
-4.53%
jan 1, 1992
6.206
+0.109
1.79%
jan 1, 1993
6.414
+0.208
3.35%
jan 1, 1994
6.864
+0.45
7.02%
jan 1, 1995
7.444
+0.58
8.45%
jan 1, 1999
6.66
-0.784
-10.53%
jan 1, 2000
6.418
-0.243
-3.64%
jan 1, 2001
6.116
-0.302
-4.71%
jan 1, 2002
6.377
+0.262
4.28%
jan 1, 2003
6.468
+0.091
1.43%
jan 1, 2004
6.36
-0.108
-1.66%
jan 1, 2005
5.947
-0.413
-6.5%
jan 1, 2006
5.747
-0.2
-3.36%
jan 1, 2007
5.743
-0.005
-0.08%
jan 1, 2008
5.484
-0.259
-4.51%
jan 1, 2009
5.519
+0.035
0.64%
jan 1, 2010
5.479
-0.04
-0.73%
jan 1, 2011
5.528
+0.049
0.89%
jan 1, 2012
5.561
+0.033
0.6%
jan 1, 2014
5.86
+0.299
5.38%
Ranking of countries by current statistics by years


Comments: