29
/
en
AIzaSyAYiBZKx7MnpbEhh9jyipgxe19OcubqV5w
April 1, 2024
101123
Canada
CAN
true
2
1
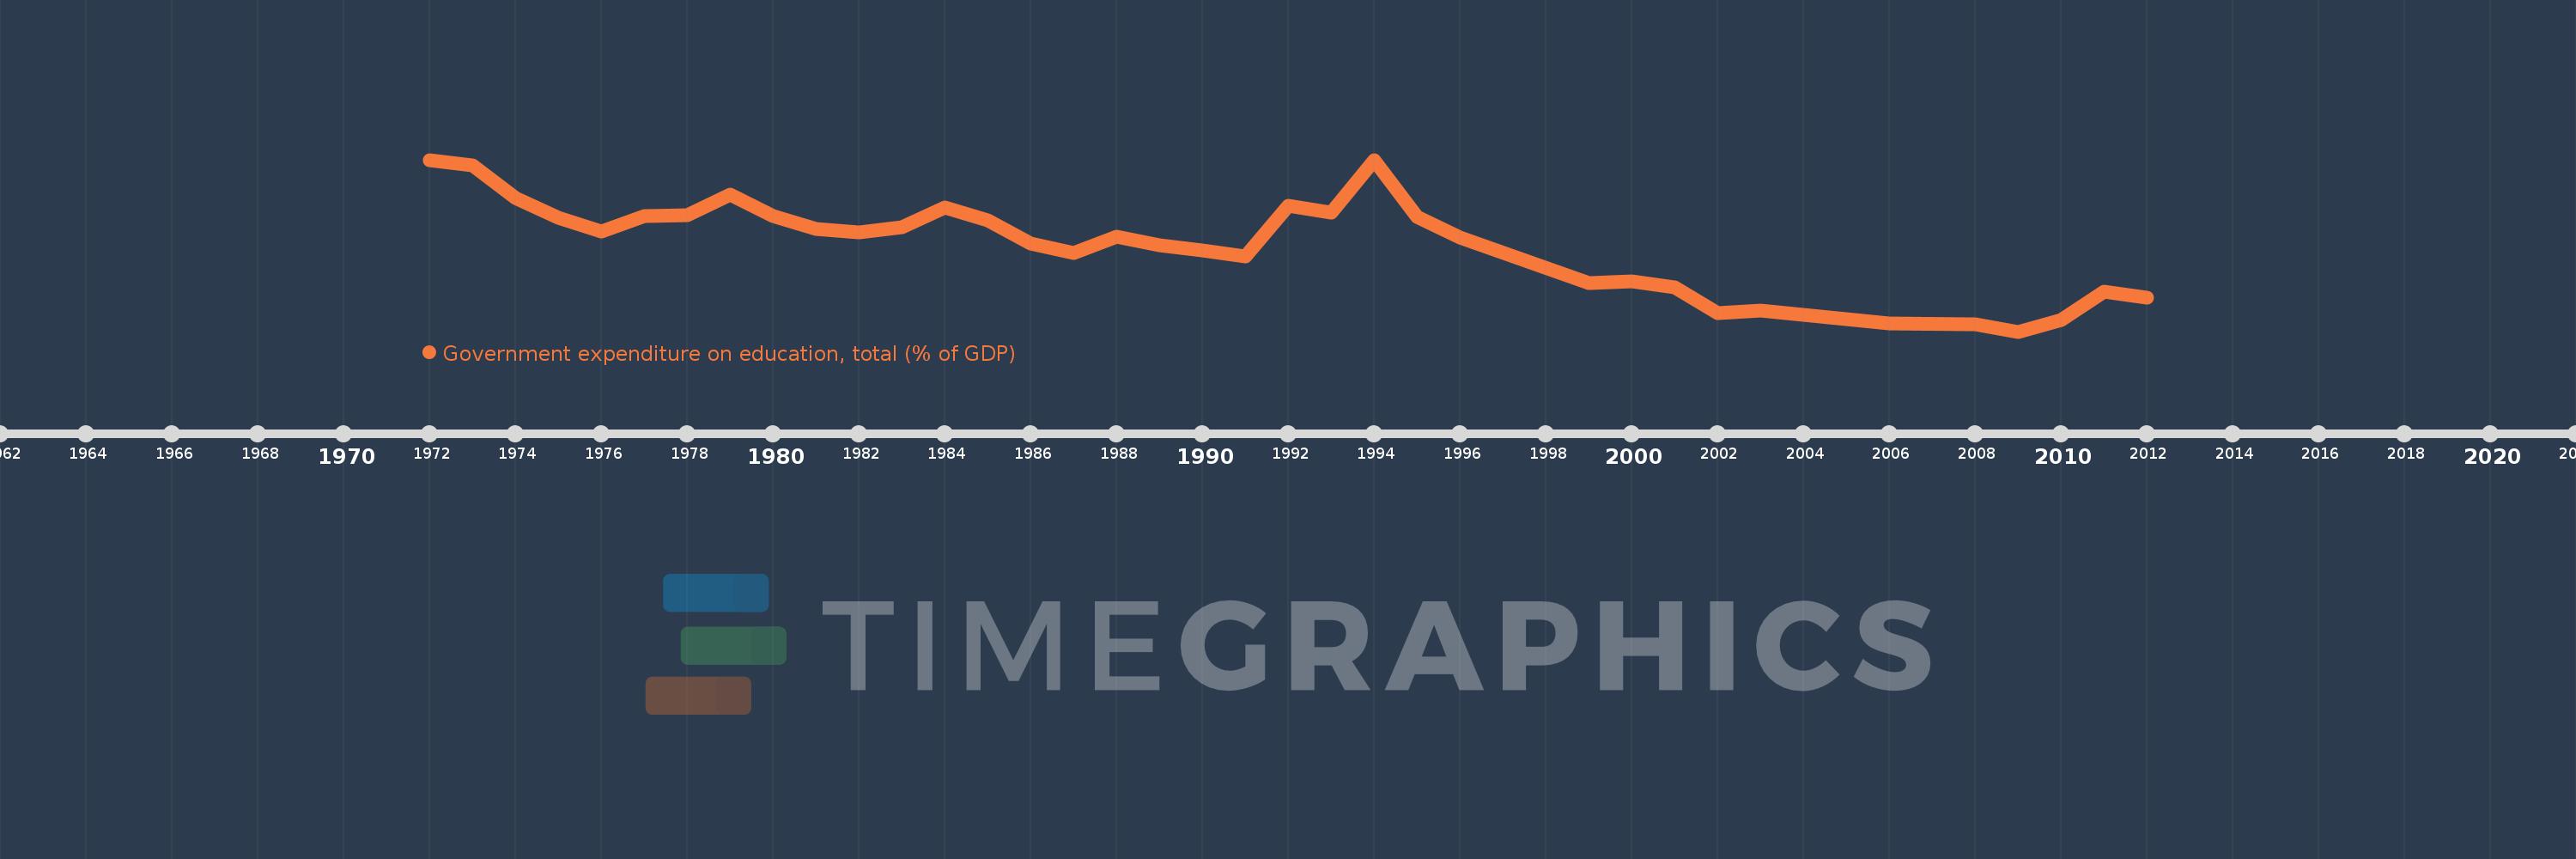
Government expenditure on education, total (% of GDP)
2012,2011,2010,2009,2008,2006,2003,2002,2001,2000,1999,1996,1995,1994,1993,1992,1991,1990,1989,1988,1987,1986,1985,1984,1983,1982,1981,1980,1979,1978,1977,1976,1975,1974,1973,1972
This statistics in other country:
AfghanistanAlbaniaAlgeriaAndorraAngolaAntigua and BarbudaArab WorldArgentinaArmeniaArubaAustraliaAustriaAzerbaijanBahamas, TheBahrainBangladeshBarbadosBelarusBelgiumBelizeBeninBermudaBhutanBoliviaBotswanaBrazilBritish Virgin IslandsBrunei DarussalamBulgariaBurkina FasoBurundiCabo VerdeCambodiaCameroonCanadaCaribbean small statesCentral African RepublicCentral Europe and the BalticsChadChileChinaColombiaComorosCongo, Dem. Rep.Congo, Rep.Costa RicaCote d'IvoireCroatiaCubaCuracaoCyprusCzech RepublicDenmarkDjiboutiDominicaDominican RepublicEarly-demographic dividendEast Asia & PacificEast Asia & Pacific (excluding high income)East Asia & Pacific (IDA & IBRD countries)EcuadorEgypt, Arab Rep.El SalvadorEquatorial GuineaEritreaEstoniaEthiopiaEuro areaEurope & Central AsiaEurope & Central Asia (excluding high income)Europe & Central Asia (IDA & IBRD countries)European UnionFijiFinlandFranceGabonGambia, TheGeorgiaGermanyGhanaGreeceGrenadaGuatemalaGuineaGuinea-BissauGuyanaHaitiHeavily indebted poor countries (HIPC)High incomeHondurasHong Kong SAR, ChinaHungaryIBRD onlyIcelandIDA & IBRD totalIDA blendIDA onlyIDA totalIndiaIndonesiaIran, Islamic Rep.IraqIrelandIsraelItalyJamaicaJapanJordanKazakhstanKenyaKiribatiKorea, Rep.KuwaitKyrgyz RepublicLao PDRLate-demographic dividendLatin America & Caribbean Latin America & Caribbean (excluding high income)Latin America & the Caribbean (IDA & IBRD countries)LatviaLeast developed countries: UN classificationLebanonLesothoLiberiaLibyaLiechtensteinLithuaniaLow & middle incomeLow incomeLower middle incomeLuxembourgMacao SAR, ChinaMacedonia, FYRMadagascarMalawiMalaysiaMaldivesMaliMaltaMarshall IslandsMauritaniaMauritiusMexicoMicronesia, Fed. Sts.Middle East & North AfricaMiddle East & North Africa (excluding high income)Middle East & North Africa (IDA & IBRD countries)Middle incomeMoldovaMonacoMongoliaMoroccoMozambiqueMyanmarNamibiaNepalNetherlandsNew ZealandNicaraguaNigerNigeriaNorth AmericaNorwayOECD membersOmanOther small statesPakistanPalauPanamaPapua New GuineaParaguayPeruPhilippinesPolandPortugalPost-demographic dividendPre-demographic dividendPuerto RicoQatarRomaniaRussian FederationRwandaSamoaSan MarinoSao Tome and PrincipeSaudi ArabiaSenegalSerbiaSeychellesSierra LeoneSingaporeSlovak RepublicSloveniaSmall statesSolomon IslandsSomaliaSouth AfricaSouth AsiaSouth Asia (IDA & IBRD)South SudanSpainSri LankaSt. Kitts and NevisSt. LuciaSt. Vincent and the GrenadinesSub-Saharan Africa Sub-Saharan Africa (excluding high income)Sub-Saharan Africa (IDA & IBRD countries)SudanSwazilandSwedenSwitzerlandSyrian Arab RepublicTajikistanTanzaniaThailandTimor-LesteTogoTongaTrinidad and TobagoTunisiaTurkeyTurkmenistanTurks and Caicos IslandsTuvaluUgandaUkraineUnited Arab EmiratesUnited KingdomUnited StatesUpper middle incomeUruguayVanuatuVenezuela, RBVietnamWorldYemen, Rep.ZambiaZimbabwe Timeline:
This timeline shows a graph from 1972 to 2012 of Canada. No data until 1971. Number of actual observations by date: 36.
Source name:
World Development Indicators
Source organization:
United Nations Educational, Scientific, and Cultural Organization (UNESCO) Institute for Statistics.
Categories, topics:
Education
Last updated:
apr 23, 2017
Indicators value changes by year
At the date of observation
Value
Absolute change
Change from previous value
jan 1, 1972
7.722
+7.722
0.0%
jan 1, 1973
7.627
-0.095
-1.23%
jan 1, 1974
7.048
-0.579
-7.59%
jan 1, 1975
6.7
-0.348
-4.94%
jan 1, 1976
6.453
-0.247
-3.69%
jan 1, 1977
6.731
+0.278
4.32%
jan 1, 1978
6.744
+0.013
0.19%
jan 1, 1979
7.108
+0.365
5.41%
jan 1, 1980
6.725
-0.384
-5.39%
jan 1, 1981
6.495
-0.23
-3.43%
jan 1, 1982
6.44
-0.054
-0.83%
jan 1, 1983
6.529
+0.089
1.38%
jan 1, 1984
6.882
+0.353
5.4%
jan 1, 1985
6.648
-0.233
-3.39%
jan 1, 1986
6.239
-0.41
-6.16%
jan 1, 1987
6.074
-0.165
-2.64%
jan 1, 1988
6.354
+0.28
4.62%
jan 1, 1989
6.209
-0.145
-2.29%
jan 1, 1990
6.114
-0.095
-1.53%
jan 1, 1991
6.007
-0.107
-1.76%
jan 1, 1992
6.907
+0.9
14.97%
jan 1, 1993
6.794
-0.113
-1.63%
jan 1, 1994
7.734
+0.94
13.83%
jan 1, 1995
6.707
-1.026
-13.27%
jan 1, 1996
6.348
-0.359
-5.36%
jan 1, 1999
5.527
-0.821
-12.93%
jan 1, 2000
5.553
+0.026
0.47%
jan 1, 2001
5.456
-0.097
-1.75%
jan 1, 2002
4.989
-0.468
-8.57%
jan 1, 2003
5.036
+0.047
0.95%
jan 1, 2006
4.805
-0.231
-4.59%
jan 1, 2008
4.797
-0.007
-0.15%
jan 1, 2009
4.661
-0.136
-2.85%
jan 1, 2010
4.873
+0.212
4.55%
jan 1, 2011
5.371
+0.498
10.22%
jan 1, 2012
5.272
-0.099
-1.84%
Ranking of countries by current statistics by years


Comments: