29
/
en
AIzaSyAYiBZKx7MnpbEhh9jyipgxe19OcubqV5w
April 1, 2024
218374
Panama
PAN
true
2
1
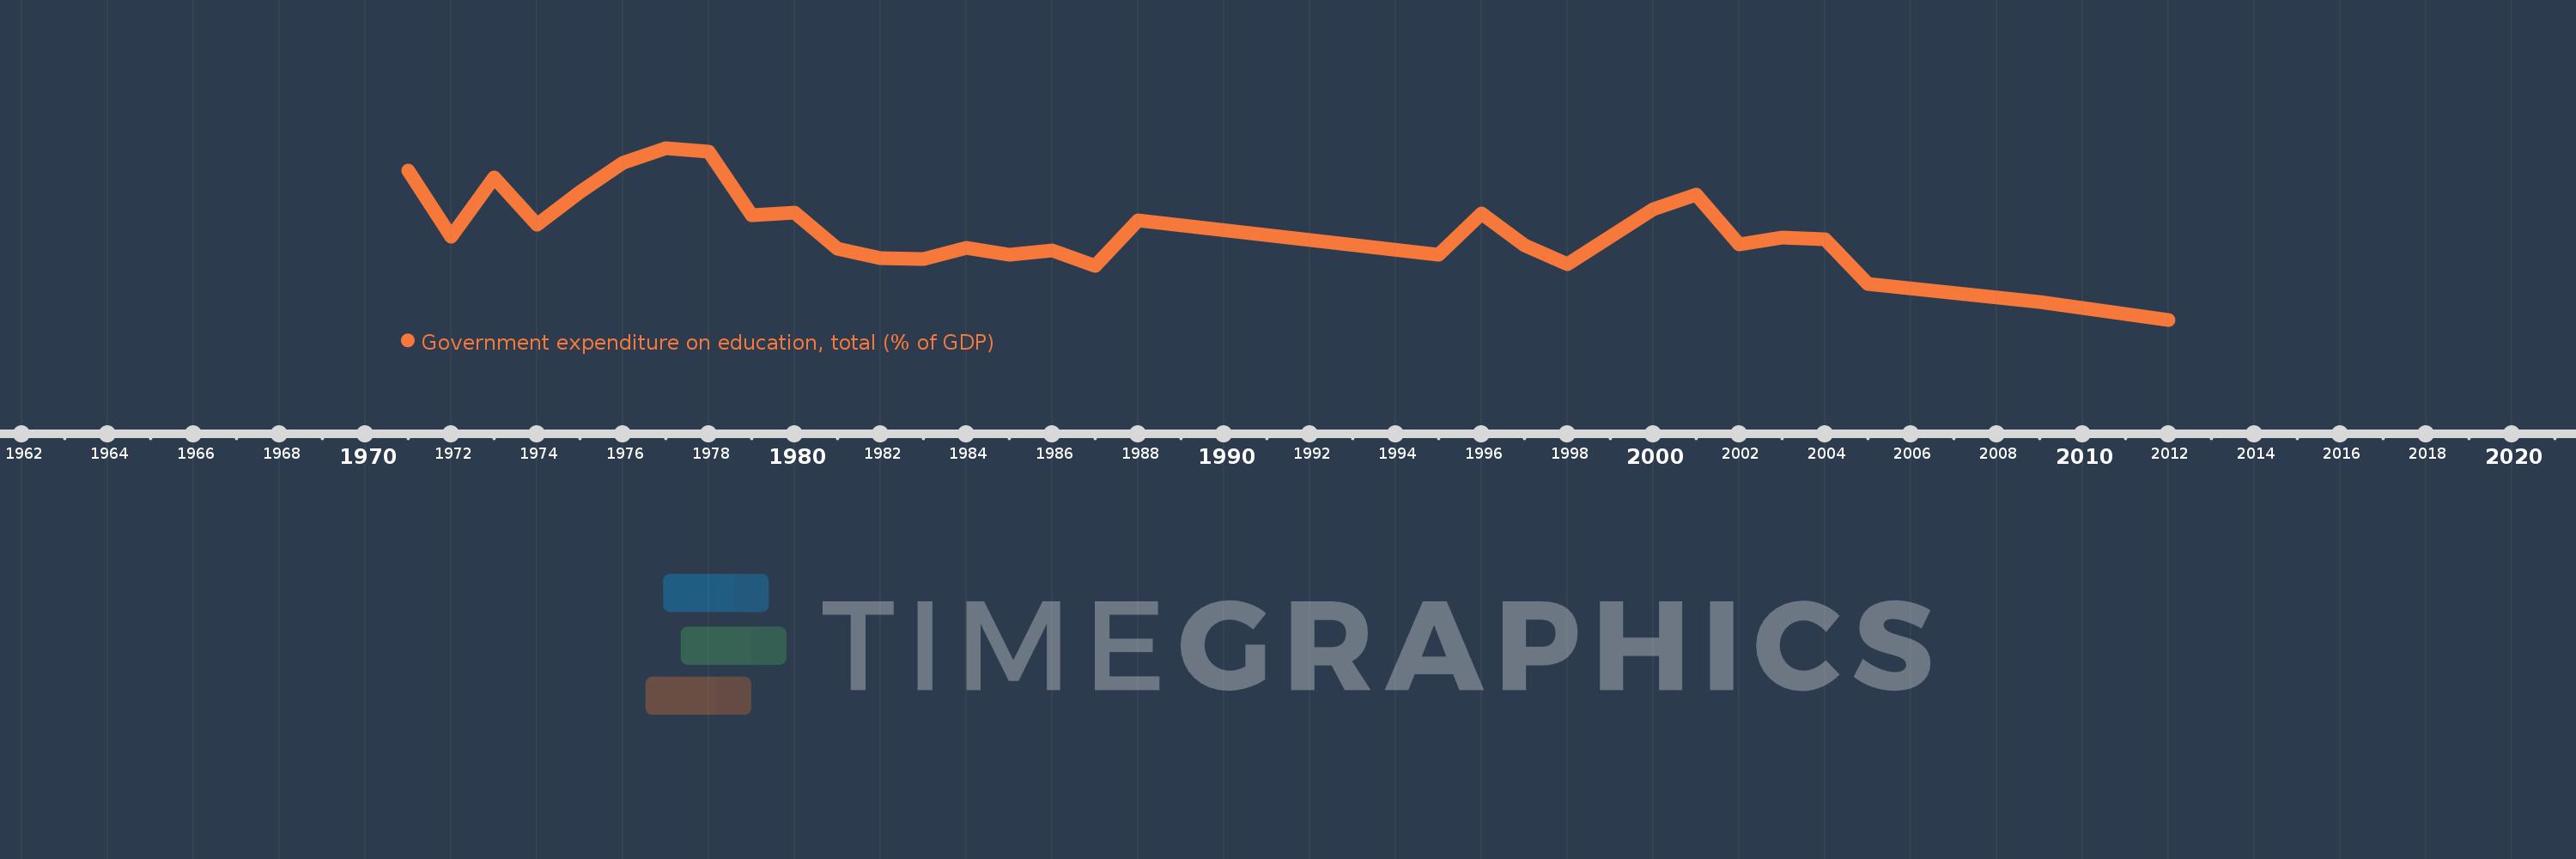
Government expenditure on education, total (% of GDP)
2012,2009,2005,2004,2003,2002,2001,2000,1998,1997,1996,1995,1988,1987,1986,1985,1984,1983,1982,1981,1980,1979,1978,1977,1976,1975,1974,1973,1972,1971
This statistics in other country:
AfghanistanAlbaniaAlgeriaAndorraAngolaAntigua and BarbudaArab WorldArgentinaArmeniaArubaAustraliaAustriaAzerbaijanBahamas, TheBahrainBangladeshBarbadosBelarusBelgiumBelizeBeninBermudaBhutanBoliviaBotswanaBrazilBritish Virgin IslandsBrunei DarussalamBulgariaBurkina FasoBurundiCabo VerdeCambodiaCameroonCanadaCaribbean small statesCentral African RepublicCentral Europe and the BalticsChadChileChinaColombiaComorosCongo, Dem. Rep.Congo, Rep.Costa RicaCote d'IvoireCroatiaCubaCuracaoCyprusCzech RepublicDenmarkDjiboutiDominicaDominican RepublicEarly-demographic dividendEast Asia & PacificEast Asia & Pacific (excluding high income)East Asia & Pacific (IDA & IBRD countries)EcuadorEgypt, Arab Rep.El SalvadorEquatorial GuineaEritreaEstoniaEthiopiaEuro areaEurope & Central AsiaEurope & Central Asia (excluding high income)Europe & Central Asia (IDA & IBRD countries)European UnionFijiFinlandFranceGabonGambia, TheGeorgiaGermanyGhanaGreeceGrenadaGuatemalaGuineaGuinea-BissauGuyanaHaitiHeavily indebted poor countries (HIPC)High incomeHondurasHong Kong SAR, ChinaHungaryIBRD onlyIcelandIDA & IBRD totalIDA blendIDA onlyIDA totalIndiaIndonesiaIran, Islamic Rep.IraqIrelandIsraelItalyJamaicaJapanJordanKazakhstanKenyaKiribatiKorea, Rep.KuwaitKyrgyz RepublicLao PDRLate-demographic dividendLatin America & Caribbean Latin America & Caribbean (excluding high income)Latin America & the Caribbean (IDA & IBRD countries)LatviaLeast developed countries: UN classificationLebanonLesothoLiberiaLibyaLiechtensteinLithuaniaLow & middle incomeLow incomeLower middle incomeLuxembourgMacao SAR, ChinaMacedonia, FYRMadagascarMalawiMalaysiaMaldivesMaliMaltaMarshall IslandsMauritaniaMauritiusMexicoMicronesia, Fed. Sts.Middle East & North AfricaMiddle East & North Africa (excluding high income)Middle East & North Africa (IDA & IBRD countries)Middle incomeMoldovaMonacoMongoliaMoroccoMozambiqueMyanmarNamibiaNepalNetherlandsNew ZealandNicaraguaNigerNigeriaNorth AmericaNorwayOECD membersOmanOther small statesPakistanPalauPanamaPapua New GuineaParaguayPeruPhilippinesPolandPortugalPost-demographic dividendPre-demographic dividendPuerto RicoQatarRomaniaRussian FederationRwandaSamoaSan MarinoSao Tome and PrincipeSaudi ArabiaSenegalSerbiaSeychellesSierra LeoneSingaporeSlovak RepublicSloveniaSmall statesSolomon IslandsSomaliaSouth AfricaSouth AsiaSouth Asia (IDA & IBRD)South SudanSpainSri LankaSt. Kitts and NevisSt. LuciaSt. Vincent and the GrenadinesSub-Saharan Africa Sub-Saharan Africa (excluding high income)Sub-Saharan Africa (IDA & IBRD countries)SudanSwazilandSwedenSwitzerlandSyrian Arab RepublicTajikistanTanzaniaThailandTimor-LesteTogoTongaTrinidad and TobagoTunisiaTurkeyTurkmenistanTurks and Caicos IslandsTuvaluUgandaUkraineUnited Arab EmiratesUnited KingdomUnited StatesUpper middle incomeUruguayVanuatuVenezuela, RBVietnamWorldYemen, Rep.ZambiaZimbabwe Timeline:
This timeline shows a graph from 1971 to 2012 of Panama. No data until 1970. Number of actual observations by date: 30.
Source name:
World Development Indicators
Source organization:
United Nations Educational, Scientific, and Cultural Organization (UNESCO) Institute for Statistics.
Categories, topics:
Education
Last updated:
apr 23, 2017
Indicators value changes by year
At the date of observation
Value
Absolute change
Change from previous value
jan 1, 1971
5.375
+5.375
0.0%
jan 1, 1972
4.457
-0.918
-17.07%
jan 1, 1973
5.29
+0.832
18.67%
jan 1, 1974
4.629
-0.661
-12.49%
jan 1, 1975
5.075
+0.446
9.64%
jan 1, 1976
5.484
+0.409
8.07%
jan 1, 1977
5.697
+0.212
3.87%
jan 1, 1978
5.643
-0.054
-0.95%
jan 1, 1979
4.75
-0.893
-15.82%
jan 1, 1980
4.787
+0.036
0.77%
jan 1, 1981
4.282
-0.505
-10.55%
jan 1, 1982
4.156
-0.126
-2.94%
jan 1, 1983
4.14
-0.016
-0.39%
jan 1, 1984
4.3
+0.16
3.87%
jan 1, 1985
4.2
-0.1
-2.31%
jan 1, 1986
4.264
+0.064
1.52%
jan 1, 1987
4.051
-0.213
-4.99%
jan 1, 1988
4.687
+0.635
15.67%
jan 1, 1995
4.203
-0.484
-10.33%
jan 1, 1996
4.781
+0.578
13.75%
jan 1, 1997
4.335
-0.445
-9.32%
jan 1, 1998
4.073
-0.262
-6.04%
jan 1, 2000
4.836
+0.762
18.72%
jan 1, 2001
5.04
+0.204
4.21%
jan 1, 2002
4.347
-0.692
-13.74%
jan 1, 2003
4.438
+0.091
2.09%
jan 1, 2004
4.414
-0.024
-0.55%
jan 1, 2005
3.789
-0.625
-14.15%
jan 1, 2009
3.541
-0.249
-6.56%
jan 1, 2012
3.293
-0.247
-6.98%
Ranking of countries by current statistics by years


Comments: