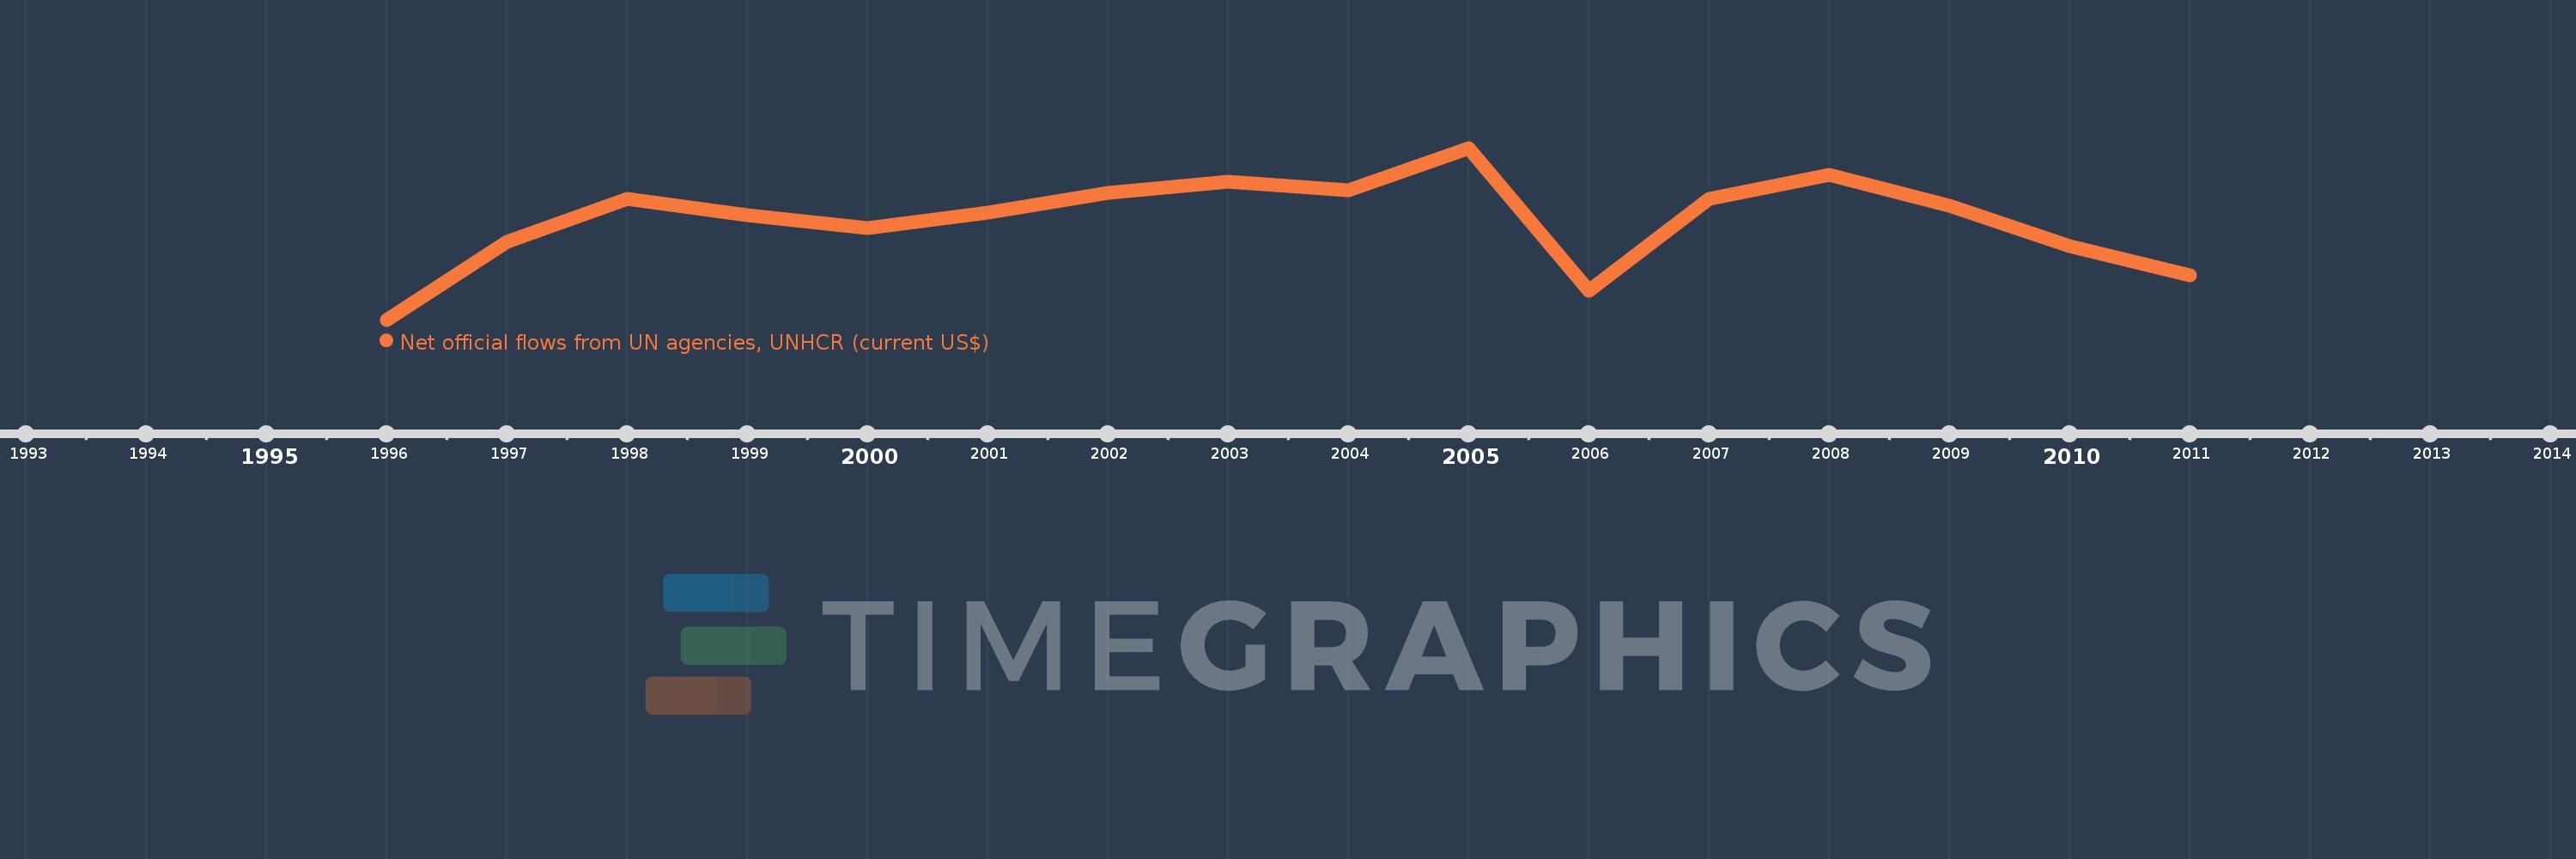
This timeline shows a graph from 1996 to 2011 of Belarus. No data until 1995. Number of actual observations by date: 16.
Source name:
World Development Indicators
Source organization:
Development Assistance Committee of the Organisation for Economic Co-operation and Development, Geographical Distribution of Financial Flows to Developing Countries, Development Co-operation Report, and International Development Statistics database. Data are available online at: www.oecd.org/dac/stats/idsonline.
Categories, topics:
Aid Effectiveness
Last updated:
apr 23, 2017
Indicators value changes by year
Meaning:
556.875K
Minimum:
110.0K
jan 1, 1996
Maximum:
880.0K
jan 1, 2005
At the date of observation
Value
Absolute change
Change from the previous value
jan 1, 1996
110.0K
+110.0K
0.0%
jan 1, 1997
460.0K
+350.0K
318.18%
jan 1, 1998
650.0K
+190.0K
41.3%
jan 1, 1999
580.0K
-70.0K
-10.77%
jan 1, 2000
520.0K
-60.0K
-10.34%
jan 1, 2001
590.0K
+70.0K
13.46%
jan 1, 2002
680.0K
+90.0K
15.25%
jan 1, 2003
730.0K
+50.0K
7.35%
jan 1, 2004
690.0K
-40.0K
-5.48%
jan 1, 2005
880.0K
+190.0K
27.54%
jan 1, 2006
240.0K
-640.0K
-72.73%
jan 1, 2007
650.0K
+410.0K
170.83%
jan 1, 2008
760.0K
+110.0K
16.92%
jan 1, 2009
620.0K
-140.0K
-18.42%
jan 1, 2010
440.0K
-180.0K
-29.03%
jan 1, 2011
310.0K
-130.0K
-29.55%
Ranking of countries by current statistics by years
