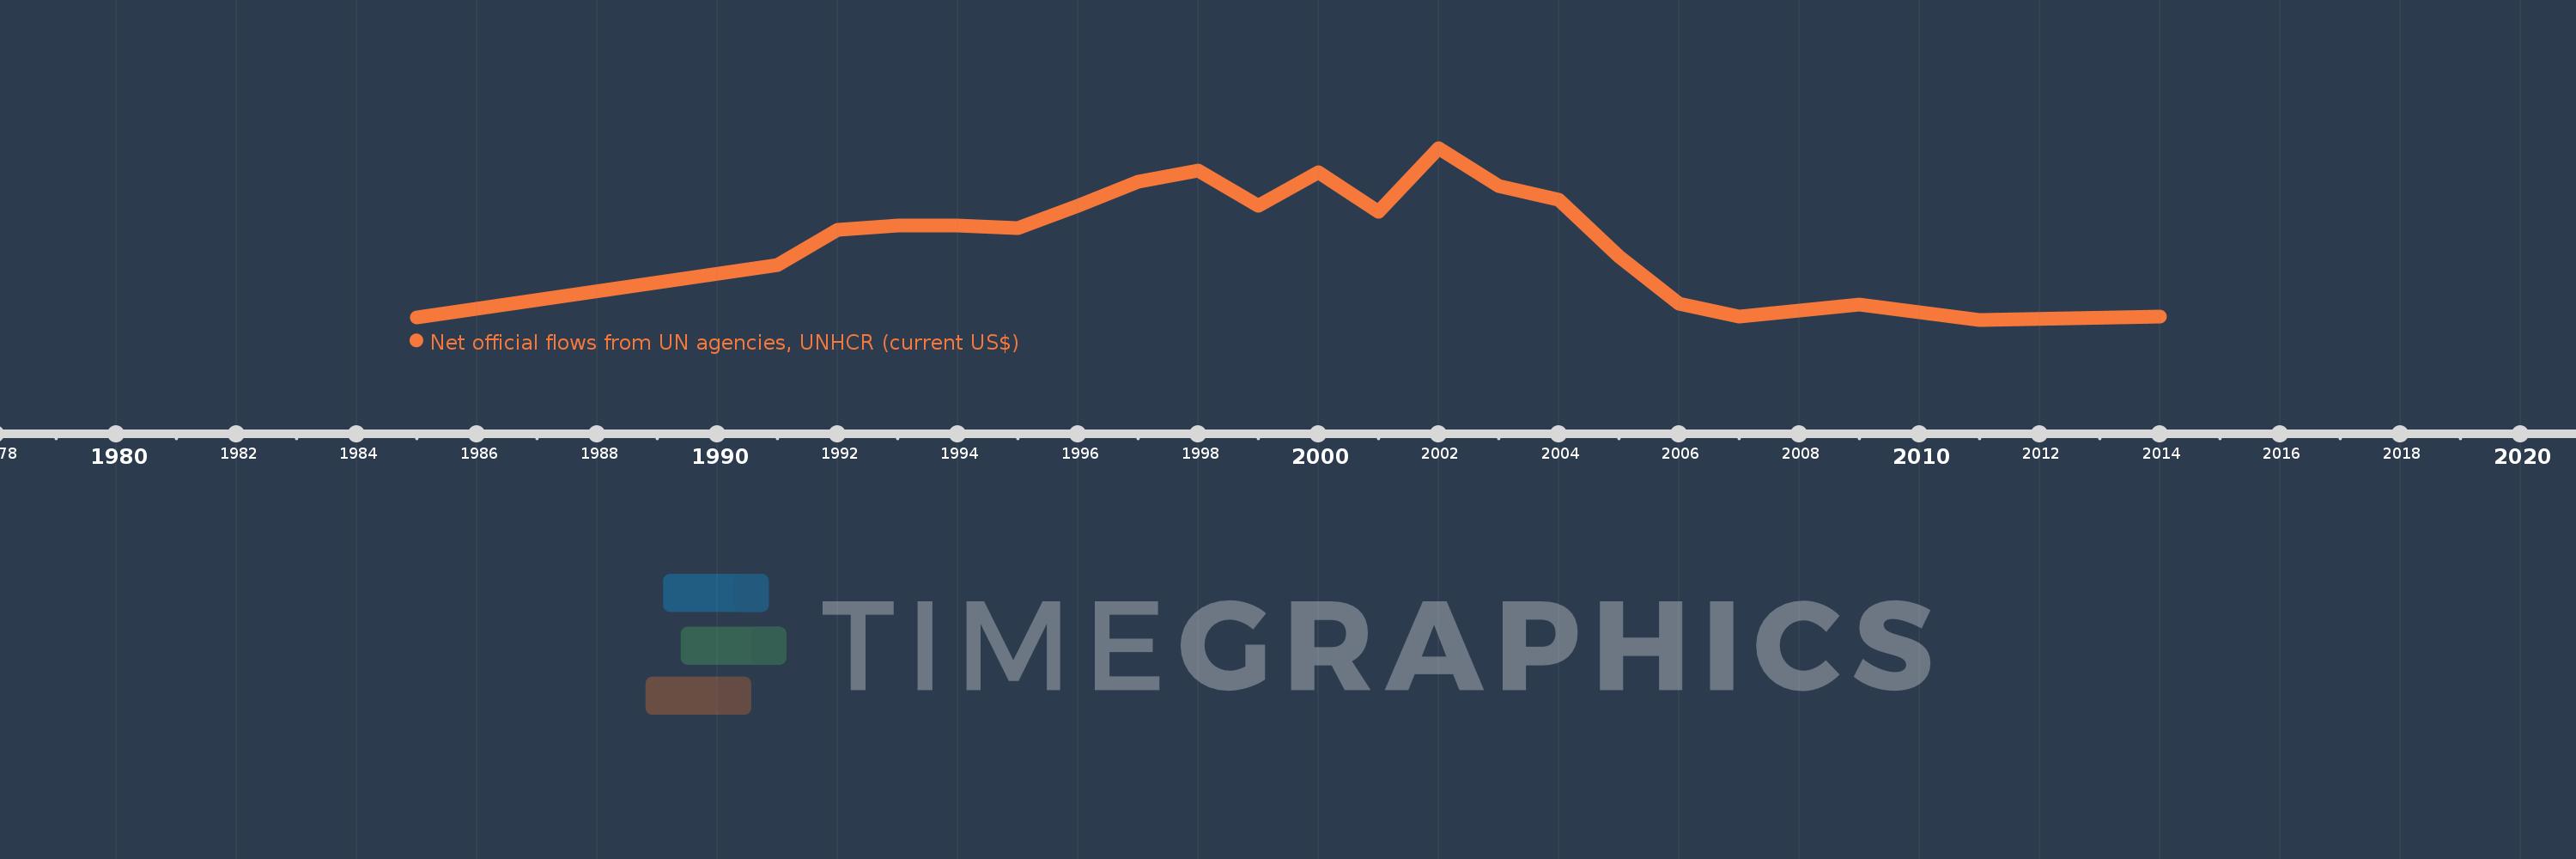
This timeline shows a graph from 1985 to 2014 of Guinea. No data until 1984. Number of actual observations by date: 23.
Source name:
World Development Indicators
Source organization:
Development Assistance Committee of the Organisation for Economic Co-operation and Development, Geographical Distribution of Financial Flows to Developing Countries, Development Co-operation Report, and International Development Statistics database. Data are available online at: www.oecd.org/dac/stats/idsonline.
Categories, topics:
Aid Effectiveness
Last updated:
apr 23, 2017
Indicators value changes by year
Meaning:
13.333 mln
Minimum:
770.0K
jan 1, 2011
Maximum:
29.31 mln
jan 1, 2002
At the date of observation
Value
Absolute change
Change from the previous value
jan 1, 1985
1.1 mln
+1.1 mln
0.0%
jan 1, 1991
9.88 mln
+8.78 mln
798.18%
jan 1, 1992
15.7 mln
+5.82 mln
58.91%
jan 1, 1993
16.46 mln
+760.0K
4.84%
jan 1, 1994
16.4 mln
-60.0K
-0.36%
jan 1, 1995
16.04 mln
-360.0K
-2.2%
jan 1, 1996
19.68 mln
+3.64 mln
22.69%
jan 1, 1997
23.66 mln
+3.98 mln
20.22%
jan 1, 1998
25.56 mln
+1.9 mln
8.03%
jan 1, 1999
19.64 mln
-5.92 mln
-23.16%
jan 1, 2000
25.24 mln
+5.6 mln
28.51%
jan 1, 2001
18.65 mln
-6.59 mln
-26.11%
jan 1, 2002
29.31 mln
+10.66 mln
57.16%
jan 1, 2003
22.98 mln
-6.33 mln
-21.6%
jan 1, 2004
20.67 mln
-2.31 mln
-10.05%
jan 1, 2005
11.22 mln
-9.45 mln
-45.72%
jan 1, 2006
3.44 mln
-7.78 mln
-69.34%
jan 1, 2007
1.32 mln
-2.12 mln
-61.63%
jan 1, 2008
2.33 mln
+1.01 mln
76.52%
jan 1, 2009
3.27 mln
+940.0K
40.34%
jan 1, 2010
2.06 mln
-1.21 mln
-37.0%
jan 1, 2011
770.0K
-1.29 mln
-62.62%
jan 1, 2014
1.28 mln
+510.0K
66.23%
Ranking of countries by current statistics by years
