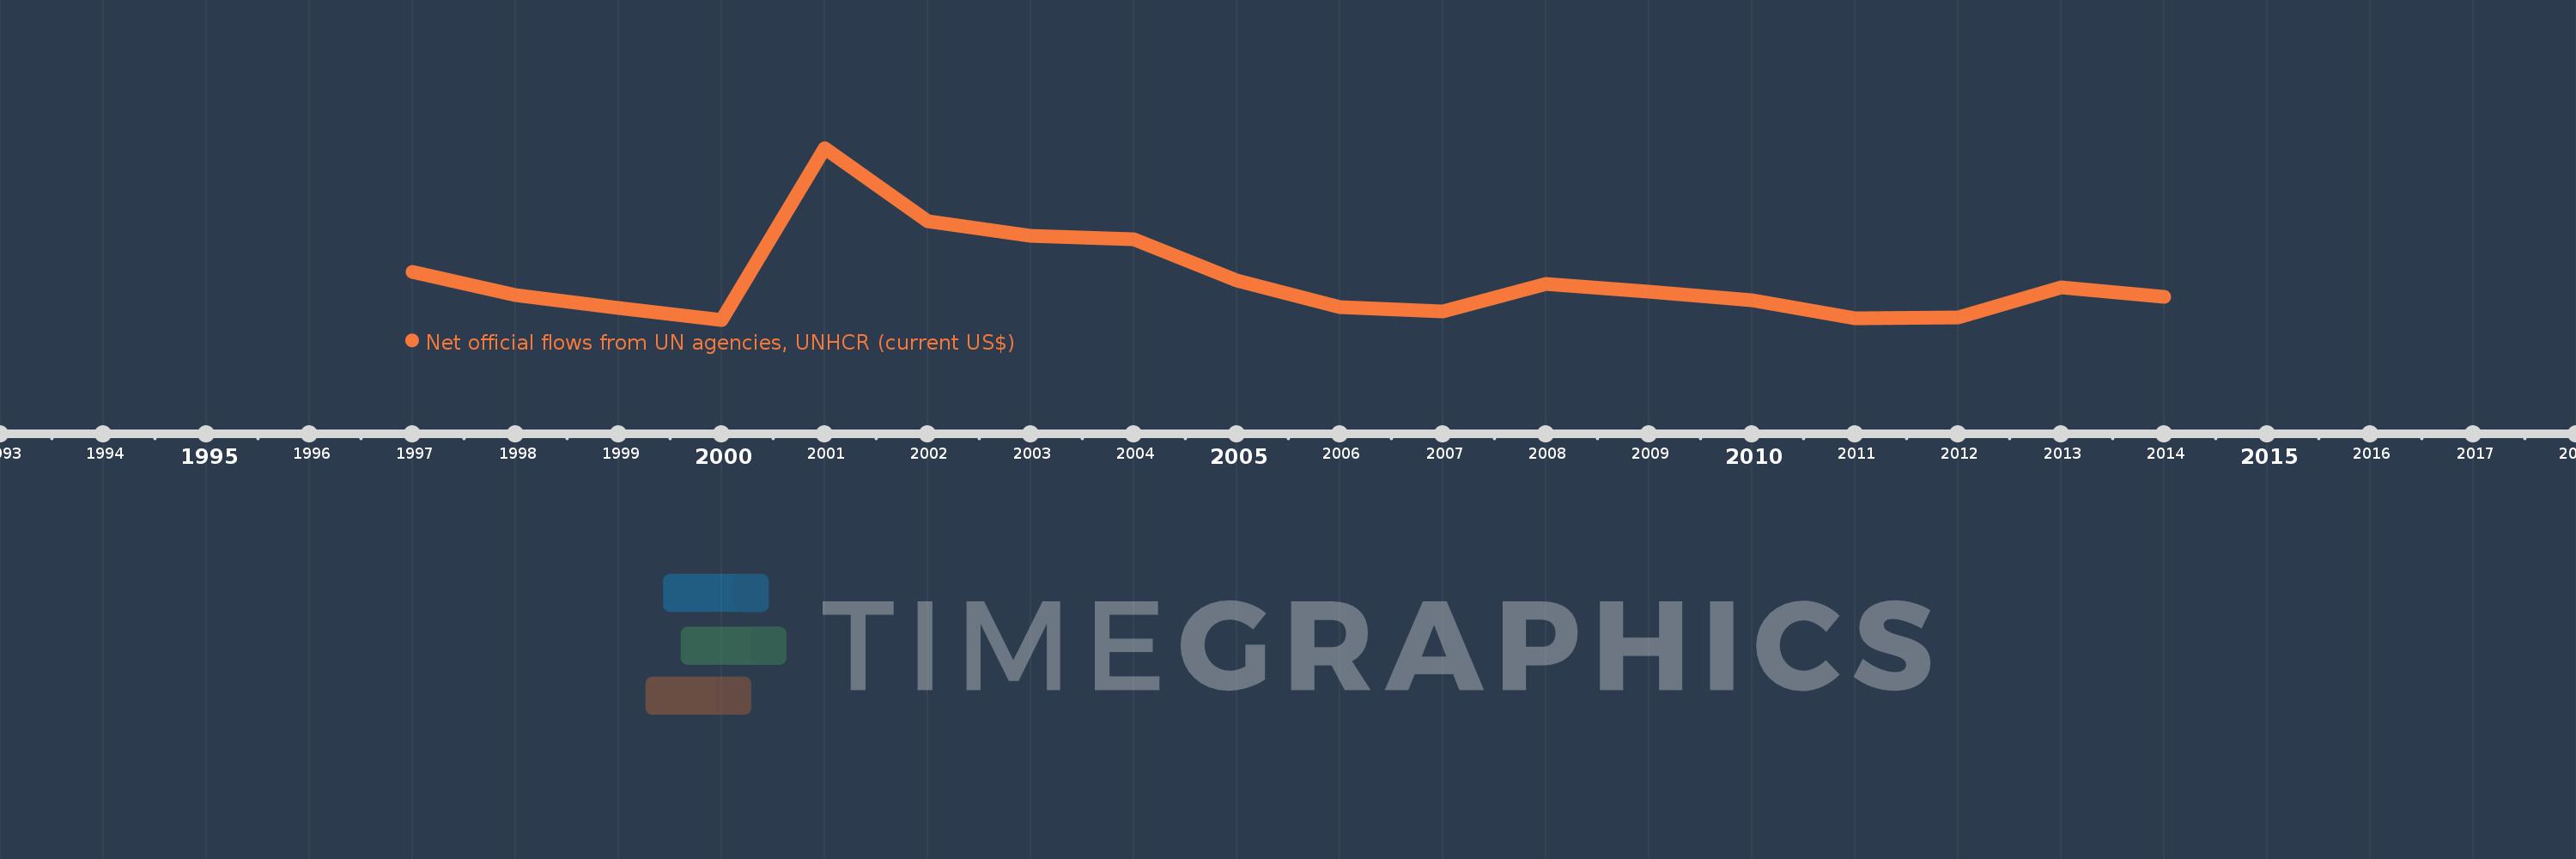
This timeline shows a graph from 1997 to 2014 of Macedonia, FYR. No data until 1996. Number of actual observations by date: 18.
Source name:
World Development Indicators
Source organization:
Development Assistance Committee of the Organisation for Economic Co-operation and Development, Geographical Distribution of Financial Flows to Developing Countries, Development Co-operation Report, and International Development Statistics database. Data are available online at: www.oecd.org/dac/stats/idsonline.
Categories, topics:
Aid Effectiveness
Last updated:
apr 23, 2017
Indicators value changes by year
Meaning:
2.205 mln
Minimum:
450.0K
jan 1, 2000
Maximum:
7.97 mln
jan 1, 2001
At the date of observation
Value
Absolute change
Change from the previous value
jan 1, 1997
2.53 mln
+2.53 mln
0.0%
jan 1, 1998
1.52 mln
-1.01 mln
-39.92%
jan 1, 1999
950.0K
-570.0K
-37.5%
jan 1, 2000
450.0K
-500.0K
-52.63%
jan 1, 2001
7.97 mln
+7.52 mln
1.67K%
jan 1, 2002
4.76 mln
-3.21 mln
-40.28%
jan 1, 2003
4.14 mln
-620.0K
-13.03%
jan 1, 2004
3.99 mln
-150.0K
-3.62%
jan 1, 2005
2.18 mln
-1.81 mln
-45.36%
jan 1, 2006
1000.0K
-1.18 mln
-54.13%
jan 1, 2007
820.0K
-180.0K
-18.0%
jan 1, 2008
2.03 mln
+1.21 mln
147.56%
jan 1, 2009
1.68 mln
-350.0K
-17.24%
jan 1, 2010
1.29 mln
-390.0K
-23.21%
jan 1, 2011
500.0K
-790.0K
-61.24%
jan 1, 2012
560.0K
+60.0K
12.0%
jan 1, 2013
1.87 mln
+1.31 mln
233.93%
jan 1, 2014
1.45 mln
-420.0K
-22.46%
Ranking of countries by current statistics by years
