30
/
AIzaSyAYiBZKx7MnpbEhh9jyipgxe19OcubqV5w
April 1, 2024
222604
Peru
PER
true
2
1
Net official flows from UN agencies, UNHCR (current US$)
2014,2000,1999,1998,1997,1996,1995,1994,1993,1992,1991,1987,1986,1985,1984,1983,1982,1981,1980,1979,1978,1977,1976
Download
Global statistics library →Peru →

Net official flows from UN agencies, UNHCR (current US$)

This statistics in other country:

AfghanistanAlbaniaAlgeriaAngolaArab WorldArgentinaArmeniaAzerbaijanBahrainBangladeshBelarusBelizeBeninBoliviaBosnia and HerzegovinaBotswanaBrazilBulgariaBurkina FasoBurundiCabo VerdeCambodiaCameroonCaribbean small statesCentral African RepublicCentral Europe and the BalticsChadChileChinaColombiaComorosCongo, Dem. Rep.Congo, Rep.Costa RicaCote d'IvoireCroatiaCubaCyprusCzech RepublicDjiboutiDominican RepublicEast Asia & PacificEast Asia & Pacific (excluding high income)East Asia & Pacific (IDA & IBRD countries)EcuadorEgypt, Arab Rep.El SalvadorEquatorial GuineaEritreaEthiopiaEuro areaEurope & Central AsiaEurope & Central Asia (excluding high income)Europe & Central Asia (IDA & IBRD countries)European UnionFragile and conflict affected situationsGabonGambia, TheGeorgiaGhanaGuatemalaGuineaGuinea-BissauHaitiHeavily indebted poor countries (HIPC)High incomeHondurasHong Kong SAR, ChinaHungaryIBRD onlyIDA & IBRD totalIDA blendIDA onlyIDA totalIndiaIndonesiaIran, Islamic Rep.IraqIsraelJamaicaJordanKazakhstanKenyaKorea, Dem. People’s Rep.Korea, Rep.KosovoKuwaitKyrgyz RepublicLao PDRLatin America & Caribbean Latin America & Caribbean (excluding high income)Latin America & the Caribbean (IDA & IBRD countries)LatviaLeast developed countries: UN classificationLebanonLesothoLiberiaLibyaLow & middle incomeLow incomeLower middle incomeMacao SAR, ChinaMacedonia, FYRMadagascarMalawiMalaysiaMaliMaltaMauritaniaMexicoMiddle East & North AfricaMiddle East & North Africa (excluding high income)Middle East & North Africa (IDA & IBRD countries)Middle incomeMoldovaMongoliaMontenegroMoroccoMozambiqueMyanmarNamibiaNepalNicaraguaNigerNigeriaOECD membersOther small statesPakistanPanamaPapua New GuineaParaguayPeruPhilippinesPolandRomaniaRussian FederationRwandaSao Tome and PrincipeSaudi ArabiaSenegalSerbiaSierra LeoneSingaporeSlovak RepublicSloveniaSmall statesSomaliaSouth AfricaSouth AsiaSouth Asia (IDA & IBRD)South SudanSri LankaSub-Saharan Africa Sub-Saharan Africa (excluding high income)Sub-Saharan Africa (IDA & IBRD countries)SudanSurinameSwazilandSyrian Arab RepublicTajikistanTanzaniaThailandTimor-LesteTogoTunisiaTurkeyTurkmenistanUgandaUkraineUnited Arab EmiratesUpper middle incomeUruguayUzbekistanVenezuela, RBVietnamWorldYemen, Rep.ZambiaZimbabwe

Timeline:

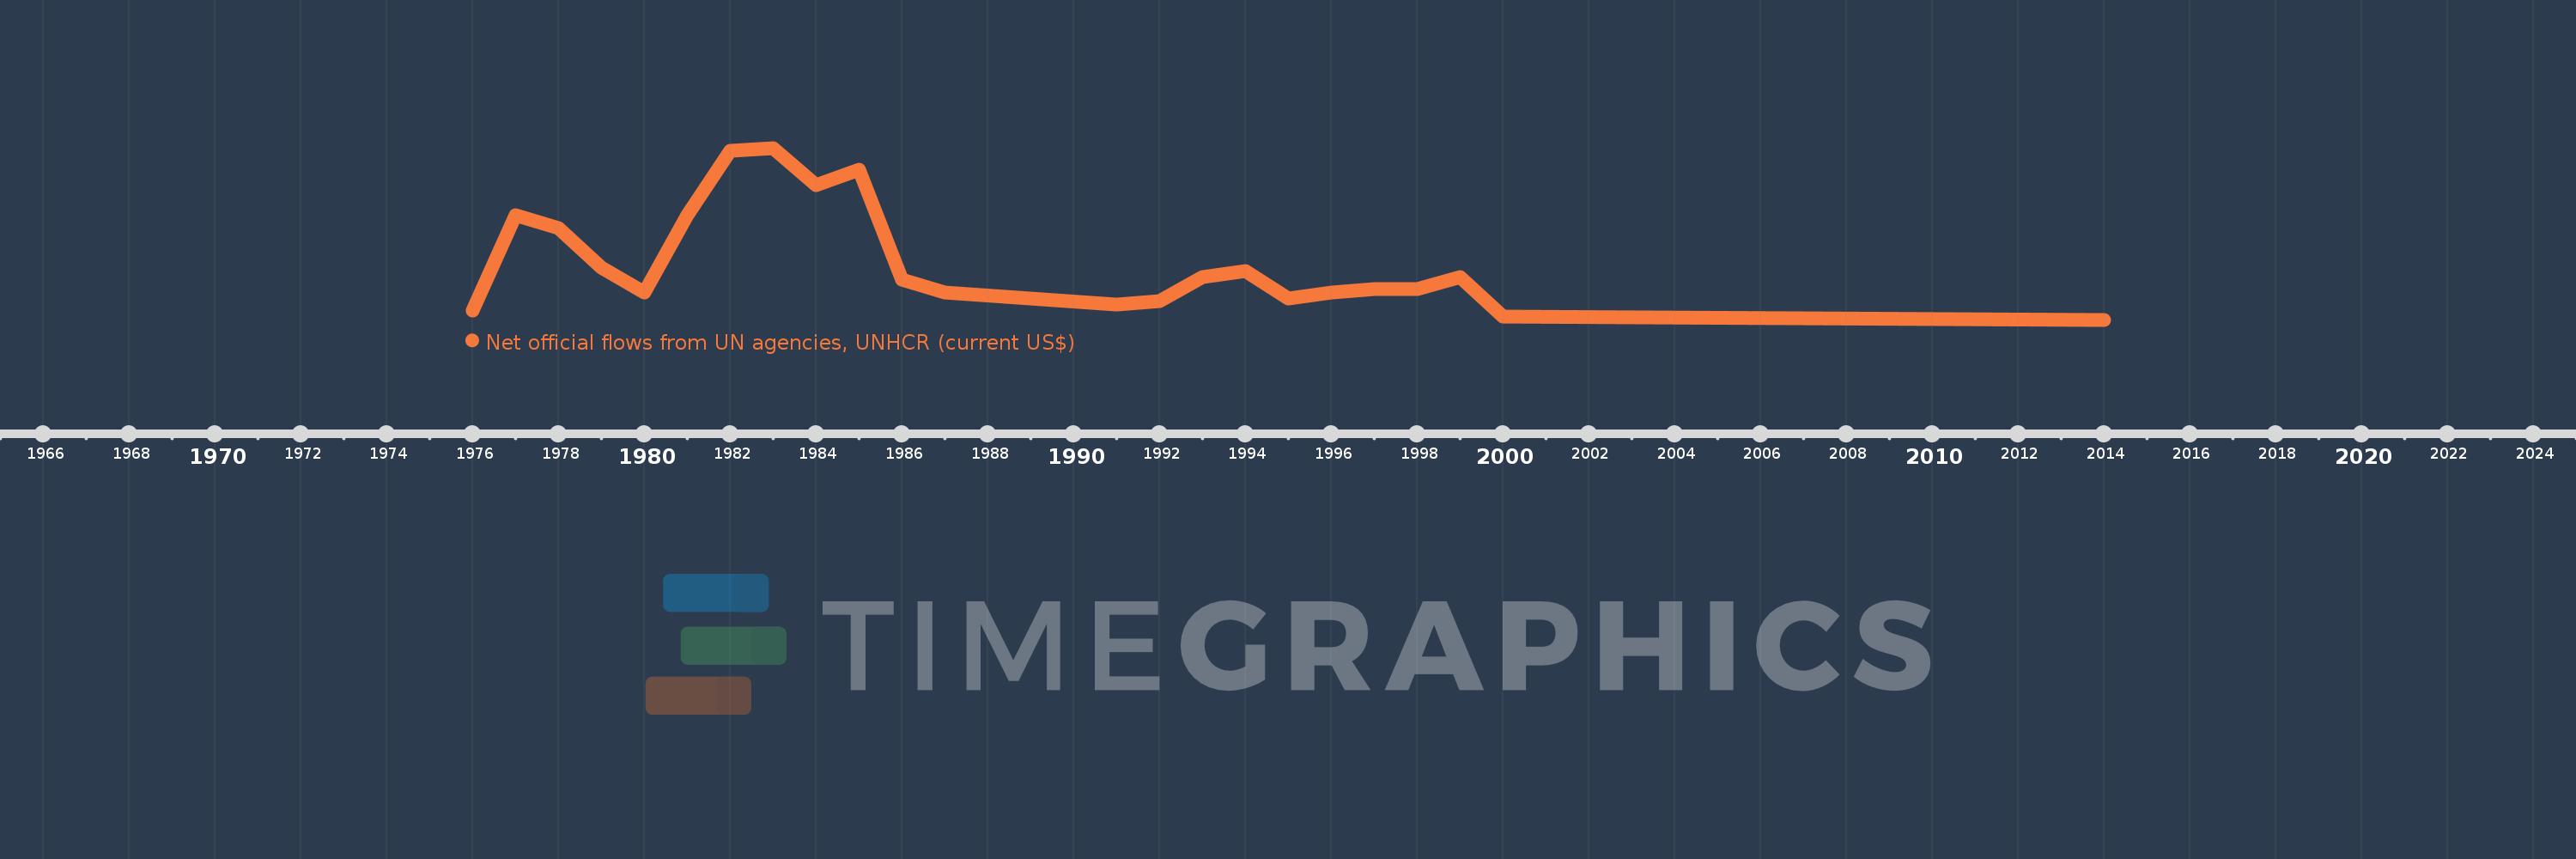
This timeline shows a graph from 1976 to 2014 of Peru. No data until 1975. Number of actual observations by date: 23.

Source name:

World Development Indicators

Source organization:

Development Assistance Committee of the Organisation for Economic Co-operation and Development, Geographical Distribution of Financial Flows to Developing Countries, Development Co-operation Report, and International Development Statistics database. Data are available online at: www.oecd.org/dac/stats/idsonline.

Categories, topics:

Aid Effectiveness

Last updated:

apr 23, 2017

Indicators value changes by year

Meaning:
193.478K
Minimum:
0.0
jan 1, 2014
Maximum:
560.0K
jan 1, 1983
At the date of observation
Value
Absolute change
Change from the previous value
jan 1, 1976
30.0K
+30.0K
0.0%
jan 1, 1977
340.0K
+310.0K
1.03K%
jan 1, 1978
300.0K
-40.0K
-11.76%
jan 1, 1979
170.0K
-130.0K
-43.33%
jan 1, 1980
90.0K
-80.0K
-47.06%
jan 1, 1981
340.0K
+250.0K
277.78%
jan 1, 1982
550.0K
+210.0K
61.76%
jan 1, 1983
560.0K
+10.0K
1.82%
jan 1, 1984
440.0K
-120.0K
-21.43%
jan 1, 1985
490.0K
+50.0K
11.36%
jan 1, 1986
130.0K
-360.0K
-73.47%
jan 1, 1987
90.0K
-40.0K
-30.77%
jan 1, 1991
50.0K
-40.0K
-44.44%
jan 1, 1992
60.0K
+10.0K
20.0%
jan 1, 1993
140.0K
+80.0K
133.33%
jan 1, 1994
160.0K
+20.0K
14.29%
jan 1, 1995
70.0K
-90.0K
-56.25%
jan 1, 1996
90.0K
+20.0K
28.57%
jan 1, 1997
100.0K
+10.0K
11.11%
jan 1, 1998
100.0K
0.0
0.0%
jan 1, 1999
140.0K
+40.0K
40.0%
jan 1, 2000
10.0K
-130.0K
-92.86%
jan 1, 2014
0.0
-10.0K
-100.0%

Ranking of countries by current statistics by years