30
/
AIzaSyAYiBZKx7MnpbEhh9jyipgxe19OcubqV5w
April 1, 2024
75412
Azerbaijan
AZE
true
2
1
Net official flows from UN agencies, UNHCR (current US$)
2013,2011,2010,2009,2008,2007,2006,2005,2004,2003,2002,2001,2000,1998,1996,1995,1994
Download
Global statistics library →Azerbaijan →

Net official flows from UN agencies, UNHCR (current US$)

This statistics in other country:

AfghanistanAlbaniaAlgeriaAngolaArab WorldArgentinaArmeniaAzerbaijanBahrainBangladeshBelarusBelizeBeninBoliviaBosnia and HerzegovinaBotswanaBrazilBulgariaBurkina FasoBurundiCabo VerdeCambodiaCameroonCaribbean small statesCentral African RepublicCentral Europe and the BalticsChadChileChinaColombiaComorosCongo, Dem. Rep.Congo, Rep.Costa RicaCote d'IvoireCroatiaCubaCyprusCzech RepublicDjiboutiDominican RepublicEast Asia & PacificEast Asia & Pacific (excluding high income)East Asia & Pacific (IDA & IBRD countries)EcuadorEgypt, Arab Rep.El SalvadorEquatorial GuineaEritreaEthiopiaEuro areaEurope & Central AsiaEurope & Central Asia (excluding high income)Europe & Central Asia (IDA & IBRD countries)European UnionFragile and conflict affected situationsGabonGambia, TheGeorgiaGhanaGuatemalaGuineaGuinea-BissauHaitiHeavily indebted poor countries (HIPC)High incomeHondurasHong Kong SAR, ChinaHungaryIBRD onlyIDA & IBRD totalIDA blendIDA onlyIDA totalIndiaIndonesiaIran, Islamic Rep.IraqIsraelJamaicaJordanKazakhstanKenyaKorea, Dem. People’s Rep.Korea, Rep.KosovoKuwaitKyrgyz RepublicLao PDRLatin America & Caribbean Latin America & Caribbean (excluding high income)Latin America & the Caribbean (IDA & IBRD countries)LatviaLeast developed countries: UN classificationLebanonLesothoLiberiaLibyaLow & middle incomeLow incomeLower middle incomeMacao SAR, ChinaMacedonia, FYRMadagascarMalawiMalaysiaMaliMaltaMauritaniaMexicoMiddle East & North AfricaMiddle East & North Africa (excluding high income)Middle East & North Africa (IDA & IBRD countries)Middle incomeMoldovaMongoliaMontenegroMoroccoMozambiqueMyanmarNamibiaNepalNicaraguaNigerNigeriaOECD membersOther small statesPakistanPanamaPapua New GuineaParaguayPeruPhilippinesPolandRomaniaRussian FederationRwandaSao Tome and PrincipeSaudi ArabiaSenegalSerbiaSierra LeoneSingaporeSlovak RepublicSloveniaSmall statesSomaliaSouth AfricaSouth AsiaSouth Asia (IDA & IBRD)South SudanSri LankaSub-Saharan Africa Sub-Saharan Africa (excluding high income)Sub-Saharan Africa (IDA & IBRD countries)SudanSurinameSwazilandSyrian Arab RepublicTajikistanTanzaniaThailandTimor-LesteTogoTunisiaTurkeyTurkmenistanUgandaUkraineUnited Arab EmiratesUpper middle incomeUruguayUzbekistanVenezuela, RBVietnamWorldYemen, Rep.ZambiaZimbabwe

Timeline:

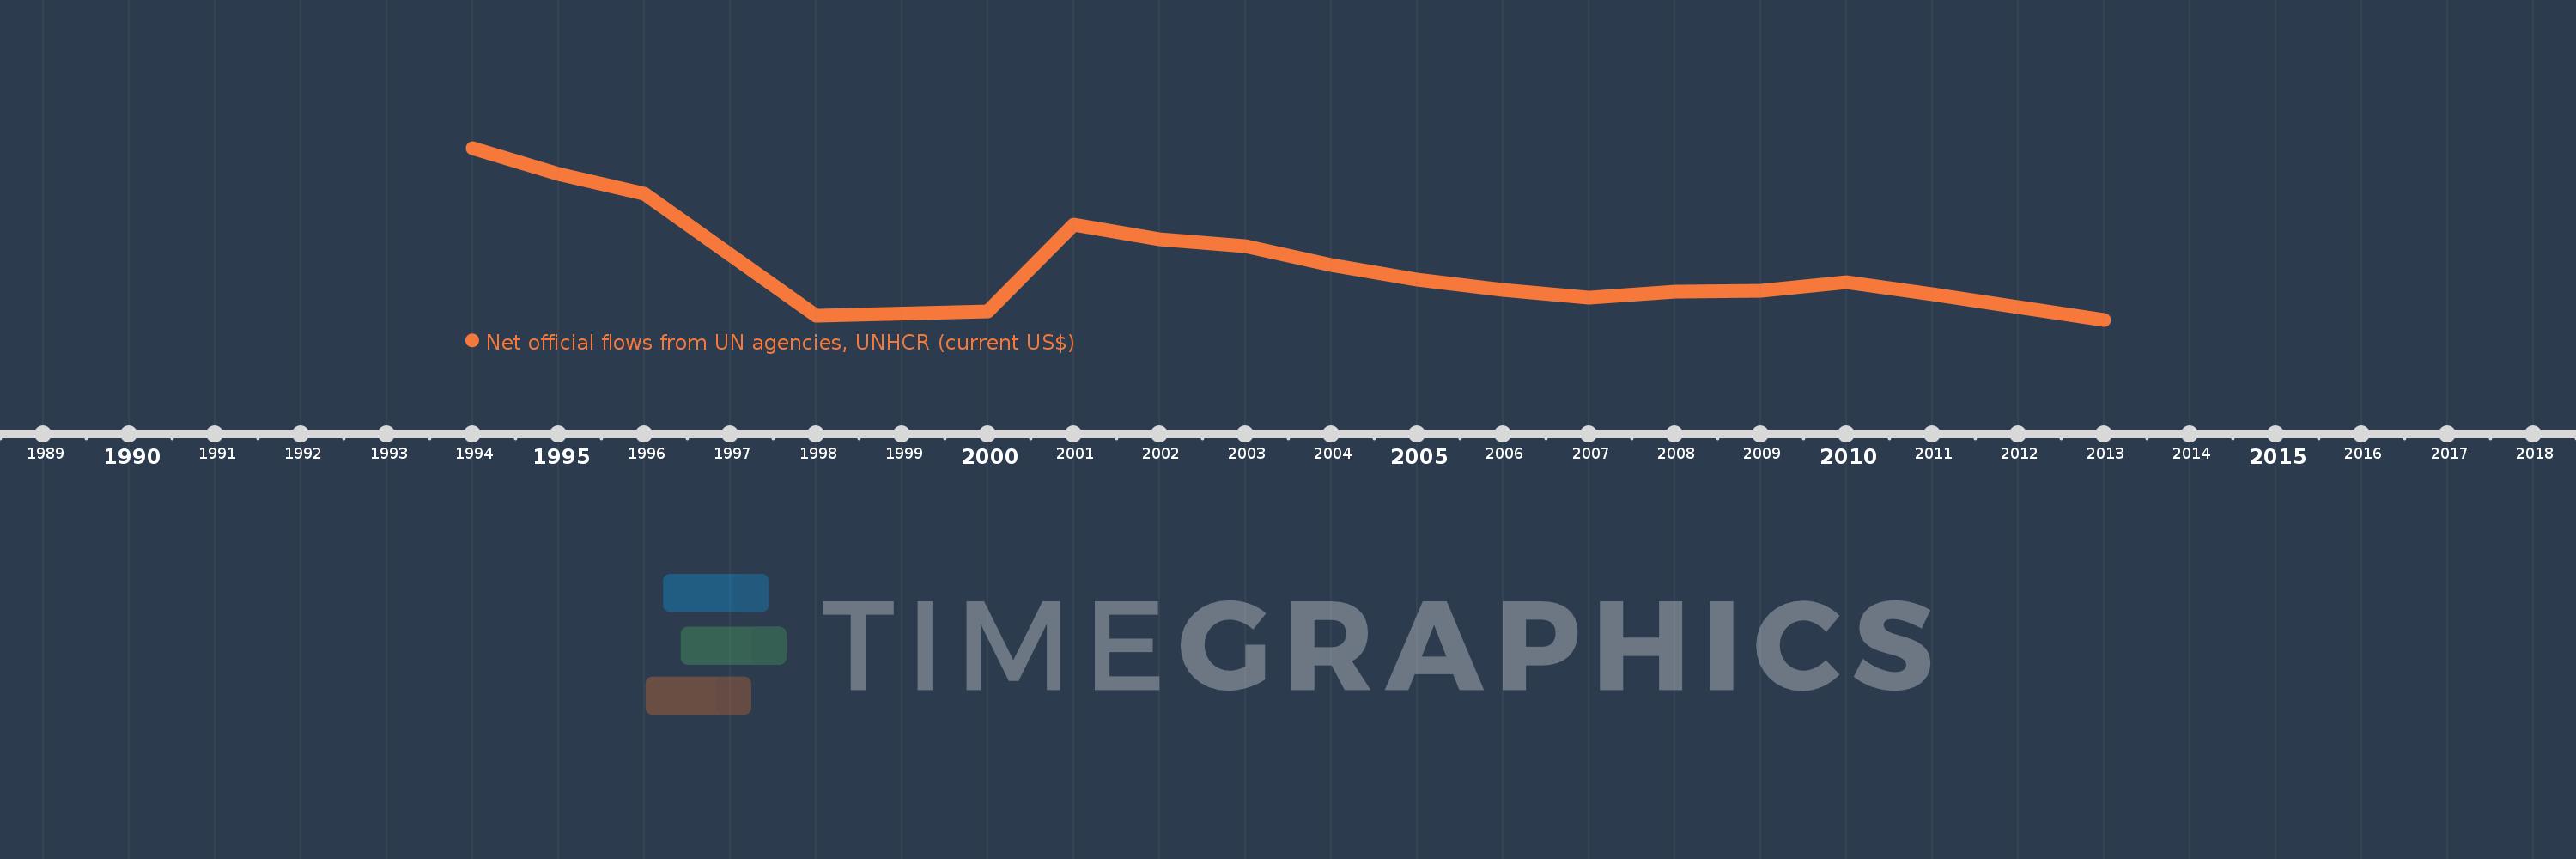
This timeline shows a graph from 1994 to 2013 of Azerbaijan. No data until 1993. Number of actual observations by date: 17.

Source name:

World Development Indicators

Source organization:

Development Assistance Committee of the Organisation for Economic Co-operation and Development, Geographical Distribution of Financial Flows to Developing Countries, Development Co-operation Report, and International Development Statistics database. Data are available online at: www.oecd.org/dac/stats/idsonline.

Categories, topics:

Aid Effectiveness

Last updated:

apr 23, 2017

Indicators value changes by year

Meaning:
2.485 mln
Minimum:
10.0K
jan 1, 2013
Maximum:
7.45 mln
jan 1, 1994
At the date of observation
Value
Absolute change
Change from the previous value
jan 1, 1994
7.45 mln
+7.45 mln
0.0%
jan 1, 1995
6.32 mln
-1.13 mln
-15.17%
jan 1, 1996
5.47 mln
-850.0K
-13.45%
jan 1, 1998
200.0K
-5.27 mln
-96.34%
jan 1, 2000
360.0K
+160.0K
80.0%
jan 1, 2001
4.11 mln
+3.75 mln
1.04K%
jan 1, 2002
3.5 mln
-610.0K
-14.84%
jan 1, 2003
3.18 mln
-320.0K
-9.14%
jan 1, 2004
2.38 mln
-800.0K
-25.16%
jan 1, 2005
1.76 mln
-620.0K
-26.05%
jan 1, 2006
1.29 mln
-470.0K
-26.7%
jan 1, 2007
980.0K
-310.0K
-24.03%
jan 1, 2008
1.22 mln
+240.0K
24.49%
jan 1, 2009
1.26 mln
+40.0K
3.28%
jan 1, 2010
1.62 mln
+360.0K
28.57%
jan 1, 2011
1.13 mln
-490.0K
-30.25%
jan 1, 2013
10.0K
-1.12 mln
-99.12%

Ranking of countries by current statistics by years