29
/
en
AIzaSyAYiBZKx7MnpbEhh9jyipgxe19OcubqV5w
April 1, 2024
240781
Singapore
SGP
true
2
1
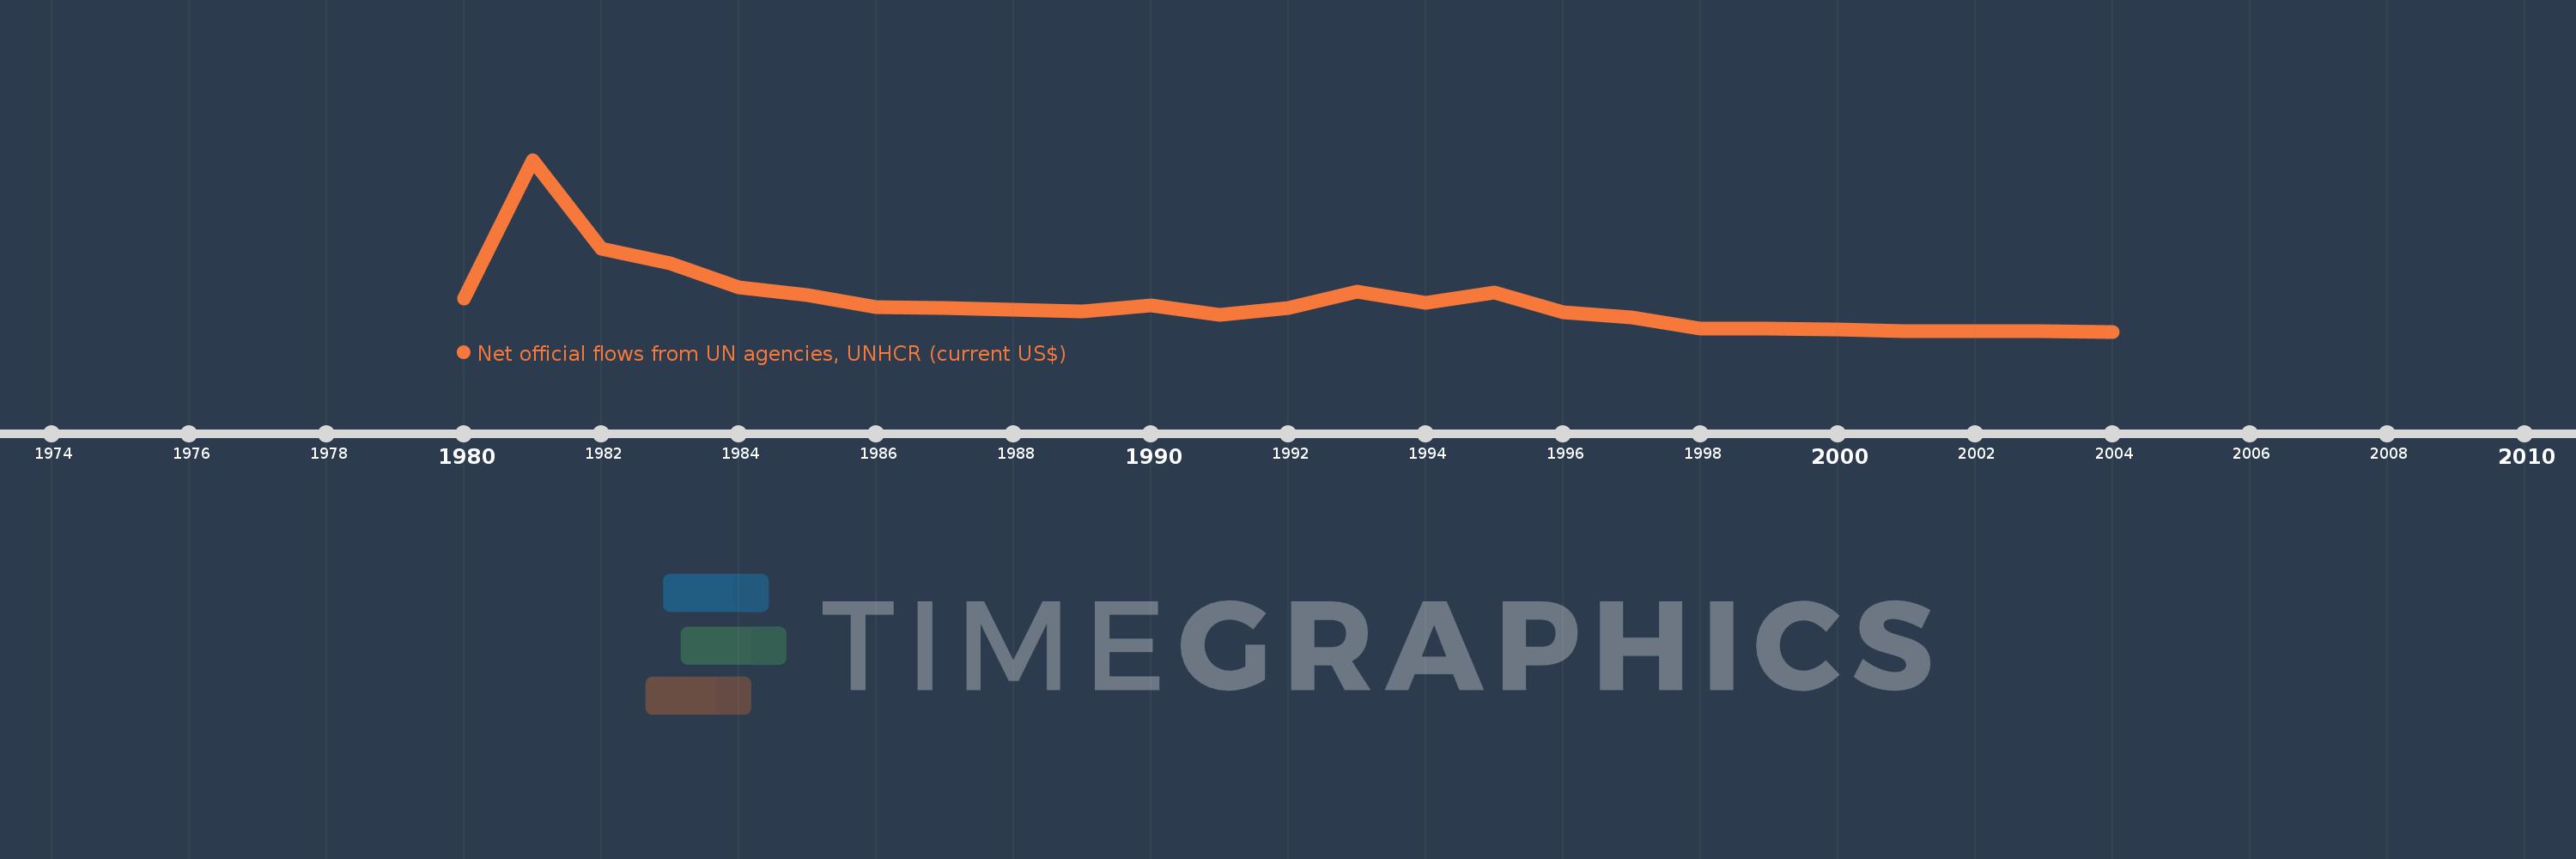
Net official flows from UN agencies, UNHCR (current US$)
2004,2003,2002,2001,2000,1999,1998,1997,1996,1995,1994,1993,1992,1991,1990,1989,1987,1986,1985,1984,1983,1982,1981,1980
This statistics in other country:
AfghanistanAlbaniaAlgeriaAngolaArab WorldArgentinaArmeniaAzerbaijanBahrainBangladeshBelarusBelizeBeninBoliviaBosnia and HerzegovinaBotswanaBrazilBulgariaBurkina FasoBurundiCabo VerdeCambodiaCameroonCaribbean small statesCentral African RepublicCentral Europe and the BalticsChadChileChinaColombiaComorosCongo, Dem. Rep.Congo, Rep.Costa RicaCote d'IvoireCroatiaCubaCyprusCzech RepublicDjiboutiDominican RepublicEast Asia & PacificEast Asia & Pacific (excluding high income)East Asia & Pacific (IDA & IBRD countries)EcuadorEgypt, Arab Rep.El SalvadorEquatorial GuineaEritreaEthiopiaEuro areaEurope & Central AsiaEurope & Central Asia (excluding high income)Europe & Central Asia (IDA & IBRD countries)European UnionFragile and conflict affected situationsGabonGambia, TheGeorgiaGhanaGuatemalaGuineaGuinea-BissauHaitiHeavily indebted poor countries (HIPC)High incomeHondurasHong Kong SAR, ChinaHungaryIBRD onlyIDA & IBRD totalIDA blendIDA onlyIDA totalIndiaIndonesiaIran, Islamic Rep.IraqIsraelJamaicaJordanKazakhstanKenyaKorea, Dem. People’s Rep.Korea, Rep.KosovoKuwaitKyrgyz RepublicLao PDRLatin America & Caribbean Latin America & Caribbean (excluding high income)Latin America & the Caribbean (IDA & IBRD countries)LatviaLeast developed countries: UN classificationLebanonLesothoLiberiaLibyaLow & middle incomeLow incomeLower middle incomeMacao SAR, ChinaMacedonia, FYRMadagascarMalawiMalaysiaMaliMaltaMauritaniaMexicoMiddle East & North AfricaMiddle East & North Africa (excluding high income)Middle East & North Africa (IDA & IBRD countries)Middle incomeMoldovaMongoliaMontenegroMoroccoMozambiqueMyanmarNamibiaNepalNicaraguaNigerNigeriaOECD membersOther small statesPakistanPanamaPapua New GuineaParaguayPeruPhilippinesPolandRomaniaRussian FederationRwandaSao Tome and PrincipeSaudi ArabiaSenegalSerbiaSierra LeoneSingaporeSlovak RepublicSloveniaSmall statesSomaliaSouth AfricaSouth AsiaSouth Asia (IDA & IBRD)South SudanSri LankaSub-Saharan Africa Sub-Saharan Africa (excluding high income)Sub-Saharan Africa (IDA & IBRD countries)SudanSurinameSwazilandSyrian Arab RepublicTajikistanTanzaniaThailandTimor-LesteTogoTunisiaTurkeyTurkmenistanUgandaUkraineUnited Arab EmiratesUpper middle incomeUruguayUzbekistanVenezuela, RBVietnamWorldYemen, Rep.ZambiaZimbabwe Timeline:
This timeline shows a graph from 1980 to 2004 of Singapore. No data until 1979. Number of actual observations by date: 24.
Source name:
World Development Indicators
Source organization:
Development Assistance Committee of the Organisation for Economic Co-operation and Development, Geographical Distribution of Financial Flows to Developing Countries, Development Co-operation Report, and International Development Statistics database. Data are available online at: www.oecd.org/dac/stats/idsonline.
Categories, topics:
Aid Effectiveness
Last updated:
apr 23, 2017
Indicators value changes by year
Maximum:
2.46 mln
jan 1, 1981
At the date of observation
Value
Absolute change
Change from previous value
jan 1, 1980
500.0K
+500.0K
0.0%
jan 1, 1981
2.46 mln
+1.96 mln
392.0%
jan 1, 1982
1.2 mln
-1.26 mln
-51.22%
jan 1, 1983
1000.0K
-200.0K
-16.67%
jan 1, 1984
660.0K
-340.0K
-34.0%
jan 1, 1985
550.0K
-110.0K
-16.67%
jan 1, 1986
380.0K
-170.0K
-30.91%
jan 1, 1987
360.0K
-20.0K
-5.26%
jan 1, 1989
320.0K
-40.0K
-11.11%
jan 1, 1990
400.0K
+80.0K
25.0%
jan 1, 1991
270.0K
-130.0K
-32.5%
jan 1, 1992
360.0K
+90.0K
33.33%
jan 1, 1993
600.0K
+240.0K
66.67%
jan 1, 1994
440.0K
-160.0K
-26.67%
jan 1, 1995
580.0K
+140.0K
31.82%
jan 1, 1996
300.0K
-280.0K
-48.28%
jan 1, 1997
230.0K
-70.0K
-23.33%
jan 1, 1998
70.0K
-160.0K
-69.57%
jan 1, 1999
70.0K
0.0
0.0%
jan 1, 2000
60.0K
-10.0K
-14.29%
jan 1, 2001
40.0K
-20.0K
-33.33%
jan 1, 2002
40.0K
0.0
0.0%
jan 1, 2003
40.0K
0.0
0.0%
jan 1, 2004
30.0K
-10.0K
-25.0%
Ranking of countries by current statistics by years


Comments: