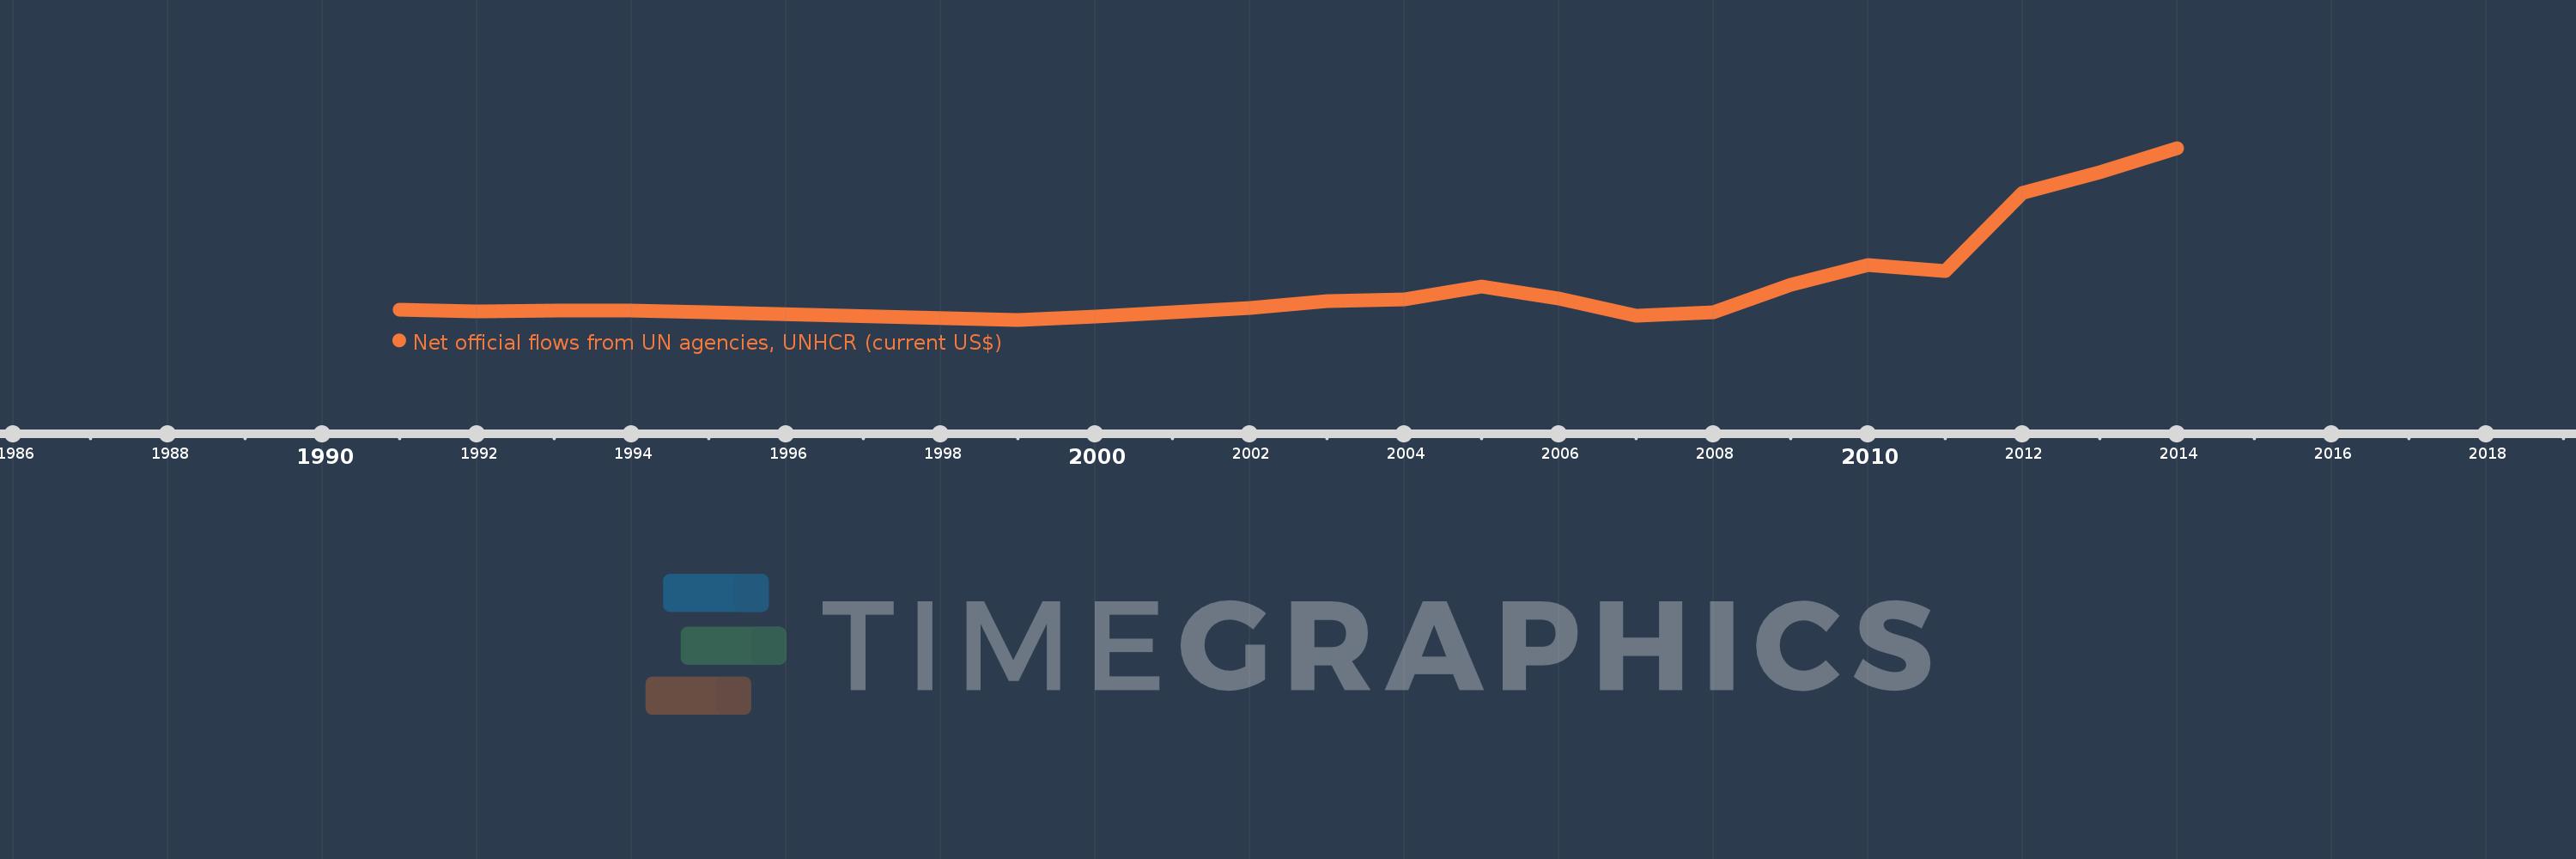
This timeline shows a graph from 1991 to 2014 of Panama. No data until 1990. Number of actual observations by date: 20.
Source name:
World Development Indicators
Source organization:
Development Assistance Committee of the Organisation for Economic Co-operation and Development, Geographical Distribution of Financial Flows to Developing Countries, Development Co-operation Report, and International Development Statistics database. Data are available online at: www.oecd.org/dac/stats/idsonline.
Categories, topics:
Aid Effectiveness
Last updated:
apr 23, 2017
Indicators value changes by year
Meaning:
754.0K
Minimum:
20.0K
jan 1, 1999
Maximum:
3.39 mln
jan 1, 2014
At the date of observation
Value
Absolute change
Change from the previous value
jan 1, 1991
220.0K
+220.0K
0.0%
jan 1, 1992
190.0K
-30.0K
-13.64%
jan 1, 1993
200.0K
+10.0K
5.26%
jan 1, 1994
200.0K
0.0
0.0%
jan 1, 1995
160.0K
-40.0K
-20.0%
jan 1, 1999
20.0K
-140.0K
-87.5%
jan 1, 2000
90.0K
+70.0K
350.0%
jan 1, 2002
250.0K
+160.0K
177.78%
jan 1, 2003
380.0K
+130.0K
52.0%
jan 1, 2004
420.0K
+40.0K
10.53%
jan 1, 2005
680.0K
+260.0K
61.9%
jan 1, 2006
430.0K
-250.0K
-36.76%
jan 1, 2007
100.0K
-330.0K
-76.74%
jan 1, 2008
160.0K
+60.0K
60.0%
jan 1, 2009
700.0K
+540.0K
337.5%
jan 1, 2010
1.09 mln
+390.0K
55.71%
jan 1, 2011
970.0K
-120.0K
-11.01%
jan 1, 2012
2.51 mln
+1.54 mln
158.76%
jan 1, 2013
2.92 mln
+410.0K
16.33%
jan 1, 2014
3.39 mln
+470.0K
16.1%
Ranking of countries by current statistics by years
