29
/
en
AIzaSyAYiBZKx7MnpbEhh9jyipgxe19OcubqV5w
April 1, 2024
34474
Fragile and conflict affected situations
FCS
false
2
1
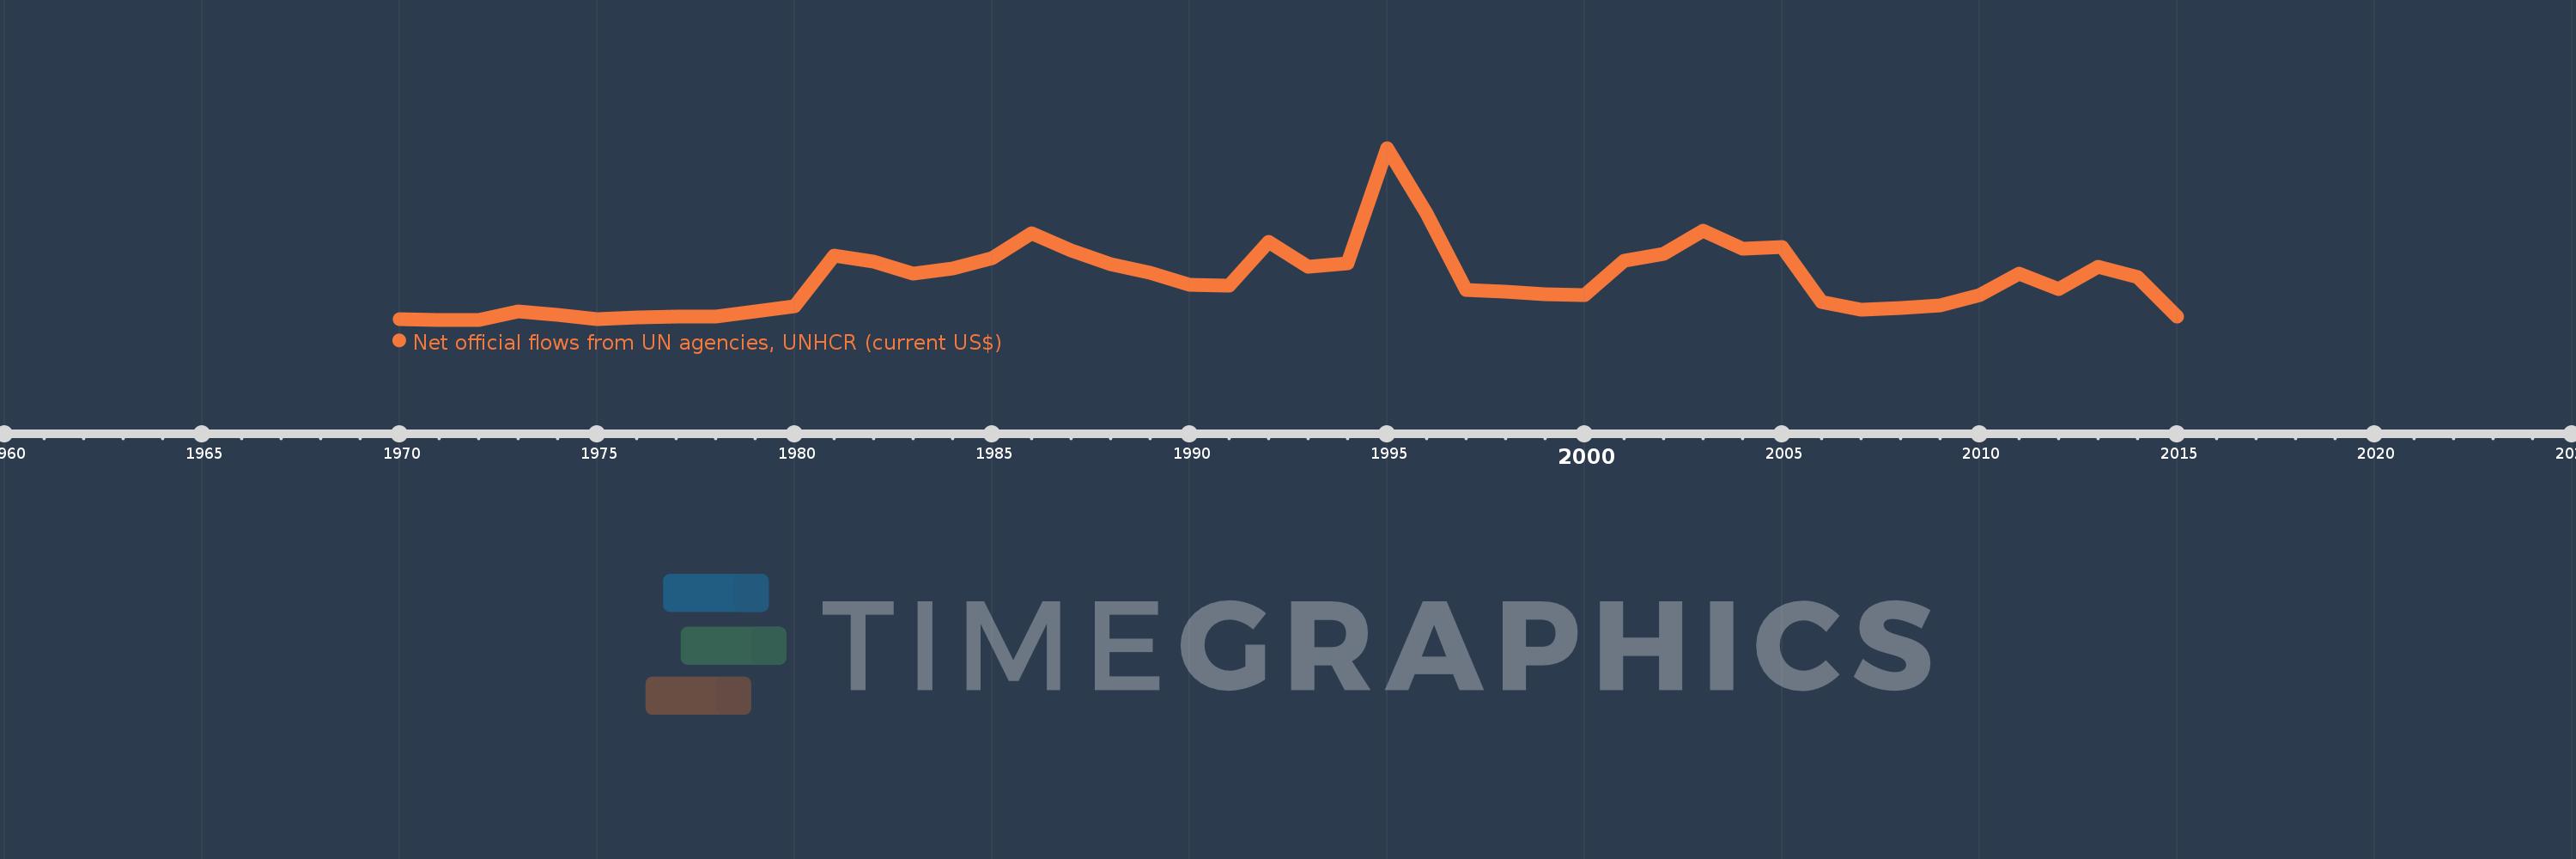
Net official flows from UN agencies, UNHCR (current US$)
2015,2014,2013,2012,2011,2010,2009,2008,2007,2006,2005,2004,2003,2002,2001,2000,1999,1998,1997,1996,1995,1994,1993,1992,1991,1990,1989,1988,1987,1986,1985,1984,1983,1982,1981,1980,1979,1978,1977,1976,1975,1974,1973,1972,1971,1970
This statistics in other country:
AfghanistanAlbaniaAlgeriaAngolaArab WorldArgentinaArmeniaAzerbaijanBahrainBangladeshBelarusBelizeBeninBoliviaBosnia and HerzegovinaBotswanaBrazilBulgariaBurkina FasoBurundiCabo VerdeCambodiaCameroonCaribbean small statesCentral African RepublicCentral Europe and the BalticsChadChileChinaColombiaComorosCongo, Dem. Rep.Congo, Rep.Costa RicaCote d'IvoireCroatiaCubaCyprusCzech RepublicDjiboutiDominican RepublicEast Asia & PacificEast Asia & Pacific (excluding high income)East Asia & Pacific (IDA & IBRD countries)EcuadorEgypt, Arab Rep.El SalvadorEquatorial GuineaEritreaEthiopiaEuro areaEurope & Central AsiaEurope & Central Asia (excluding high income)Europe & Central Asia (IDA & IBRD countries)European UnionFragile and conflict affected situationsGabonGambia, TheGeorgiaGhanaGuatemalaGuineaGuinea-BissauHaitiHeavily indebted poor countries (HIPC)High incomeHondurasHong Kong SAR, ChinaHungaryIBRD onlyIDA & IBRD totalIDA blendIDA onlyIDA totalIndiaIndonesiaIran, Islamic Rep.IraqIsraelJamaicaJordanKazakhstanKenyaKorea, Dem. People’s Rep.Korea, Rep.KosovoKuwaitKyrgyz RepublicLao PDRLatin America & Caribbean Latin America & Caribbean (excluding high income)Latin America & the Caribbean (IDA & IBRD countries)LatviaLeast developed countries: UN classificationLebanonLesothoLiberiaLibyaLow & middle incomeLow incomeLower middle incomeMacao SAR, ChinaMacedonia, FYRMadagascarMalawiMalaysiaMaliMaltaMauritaniaMexicoMiddle East & North AfricaMiddle East & North Africa (excluding high income)Middle East & North Africa (IDA & IBRD countries)Middle incomeMoldovaMongoliaMontenegroMoroccoMozambiqueMyanmarNamibiaNepalNicaraguaNigerNigeriaOECD membersOther small statesPakistanPanamaPapua New GuineaParaguayPeruPhilippinesPolandRomaniaRussian FederationRwandaSao Tome and PrincipeSaudi ArabiaSenegalSerbiaSierra LeoneSingaporeSlovak RepublicSloveniaSmall statesSomaliaSouth AfricaSouth AsiaSouth Asia (IDA & IBRD)South SudanSri LankaSub-Saharan Africa Sub-Saharan Africa (excluding high income)Sub-Saharan Africa (IDA & IBRD countries)SudanSurinameSwazilandSyrian Arab RepublicTajikistanTanzaniaThailandTimor-LesteTogoTunisiaTurkeyTurkmenistanUgandaUkraineUnited Arab EmiratesUpper middle incomeUruguayUzbekistanVenezuela, RBVietnamWorldYemen, Rep.ZambiaZimbabwe Timeline:
This timeline shows a graph from 1970 to 2015 of Fragile and conflict affected situations. No data until 1969. Number of actual observations by date: 46.
Source name:
World Development Indicators
Source organization:
Development Assistance Committee of the Organisation for Economic Co-operation and Development, Geographical Distribution of Financial Flows to Developing Countries, Development Co-operation Report, and International Development Statistics database. Data are available online at: www.oecd.org/dac/stats/idsonline.
Categories, topics:
Aid Effectiveness
Last updated:
apr 23, 2017
Indicators value changes by year
Minimum:
1.74 mln
jan 1, 1971
Maximum:
307.51 mln
jan 1, 1995
At the date of observation
Value
Absolute change
Change from previous value
jan 1, 1970
2.48 mln
+2.48 mln
0.0%
jan 1, 1971
1.74 mln
-740.0K
-29.84%
jan 1, 1972
2.03 mln
+290.0K
16.67%
jan 1, 1973
15.99 mln
+13.96 mln
687.68%
jan 1, 1974
10.51 mln
-5.48 mln
-34.27%
jan 1, 1975
3.44 mln
-7.07 mln
-67.27%
jan 1, 1976
5.18 mln
+1.74 mln
50.58%
jan 1, 1977
7.08 mln
+1.9 mln
36.68%
jan 1, 1978
7.44 mln
+360.0K
5.08%
jan 1, 1979
17.29 mln
+9.85 mln
132.39%
jan 1, 1980
25.17 mln
+7.88 mln
45.58%
jan 1, 1981
115.9 mln
+90.73 mln
360.47%
jan 1, 1982
105.29 mln
-10.61 mln
-9.15%
jan 1, 1983
83.54 mln
-21.75 mln
-20.66%
jan 1, 1984
93.62 mln
+10.08 mln
12.07%
jan 1, 1985
110.6 mln
+16.98 mln
18.14%
jan 1, 1986
155.72 mln
+45.12 mln
40.8%
jan 1, 1987
124.77 mln
-30.95 mln
-19.88%
jan 1, 1988
100.9 mln
-23.87 mln
-19.13%
jan 1, 1989
84.97 mln
-15.93 mln
-15.79%
jan 1, 1990
64.07 mln
-20.9 mln
-24.6%
jan 1, 1991
62.07 mln
-2.0 mln
-3.12%
jan 1, 1992
140.19 mln
+78.12 mln
125.86%
jan 1, 1993
95.76 mln
-44.43 mln
-31.69%
jan 1, 1994
102.43 mln
+6.67 mln
6.97%
jan 1, 1995
307.51 mln
+205.08 mln
200.21%
jan 1, 1996
191.11 mln
-116.4 mln
-37.85%
jan 1, 1997
55.42 mln
-135.69 mln
-71.0%
jan 1, 1998
51.16 mln
-4.26 mln
-7.69%
jan 1, 1999
47.5 mln
-3.66 mln
-7.15%
jan 1, 2000
46.08 mln
-1.42 mln
-2.99%
jan 1, 2001
107.4 mln
+61.32 mln
133.07%
jan 1, 2002
118.34 mln
+10.94 mln
10.19%
jan 1, 2003
160.47 mln
+42.13 mln
35.6%
jan 1, 2004
127.67 mln
-32.8 mln
-20.44%
jan 1, 2005
131.8 mln
+4.13 mln
3.23%
jan 1, 2006
33.81 mln
-97.99 mln
-74.35%
jan 1, 2007
20.38 mln
-13.43 mln
-39.72%
jan 1, 2008
22.87 mln
+2.49 mln
12.22%
jan 1, 2009
27.04 mln
+4.17 mln
18.23%
jan 1, 2010
45.86 mln
+18.82 mln
69.6%
jan 1, 2011
84.17 mln
+38.31 mln
83.54%
jan 1, 2012
56.8 mln
-27.37 mln
-32.52%
jan 1, 2013
96.38 mln
+39.58 mln
69.68%
jan 1, 2014
77.81 mln
-18.57 mln
-19.27%
jan 1, 2015
7.34 mln
-70.47 mln
-90.57%
Ranking of countries by current statistics by years


Comments: