29
/
en
AIzaSyAYiBZKx7MnpbEhh9jyipgxe19OcubqV5w
April 1, 2024
76617
Bahamas, The
BHS
true
2
1
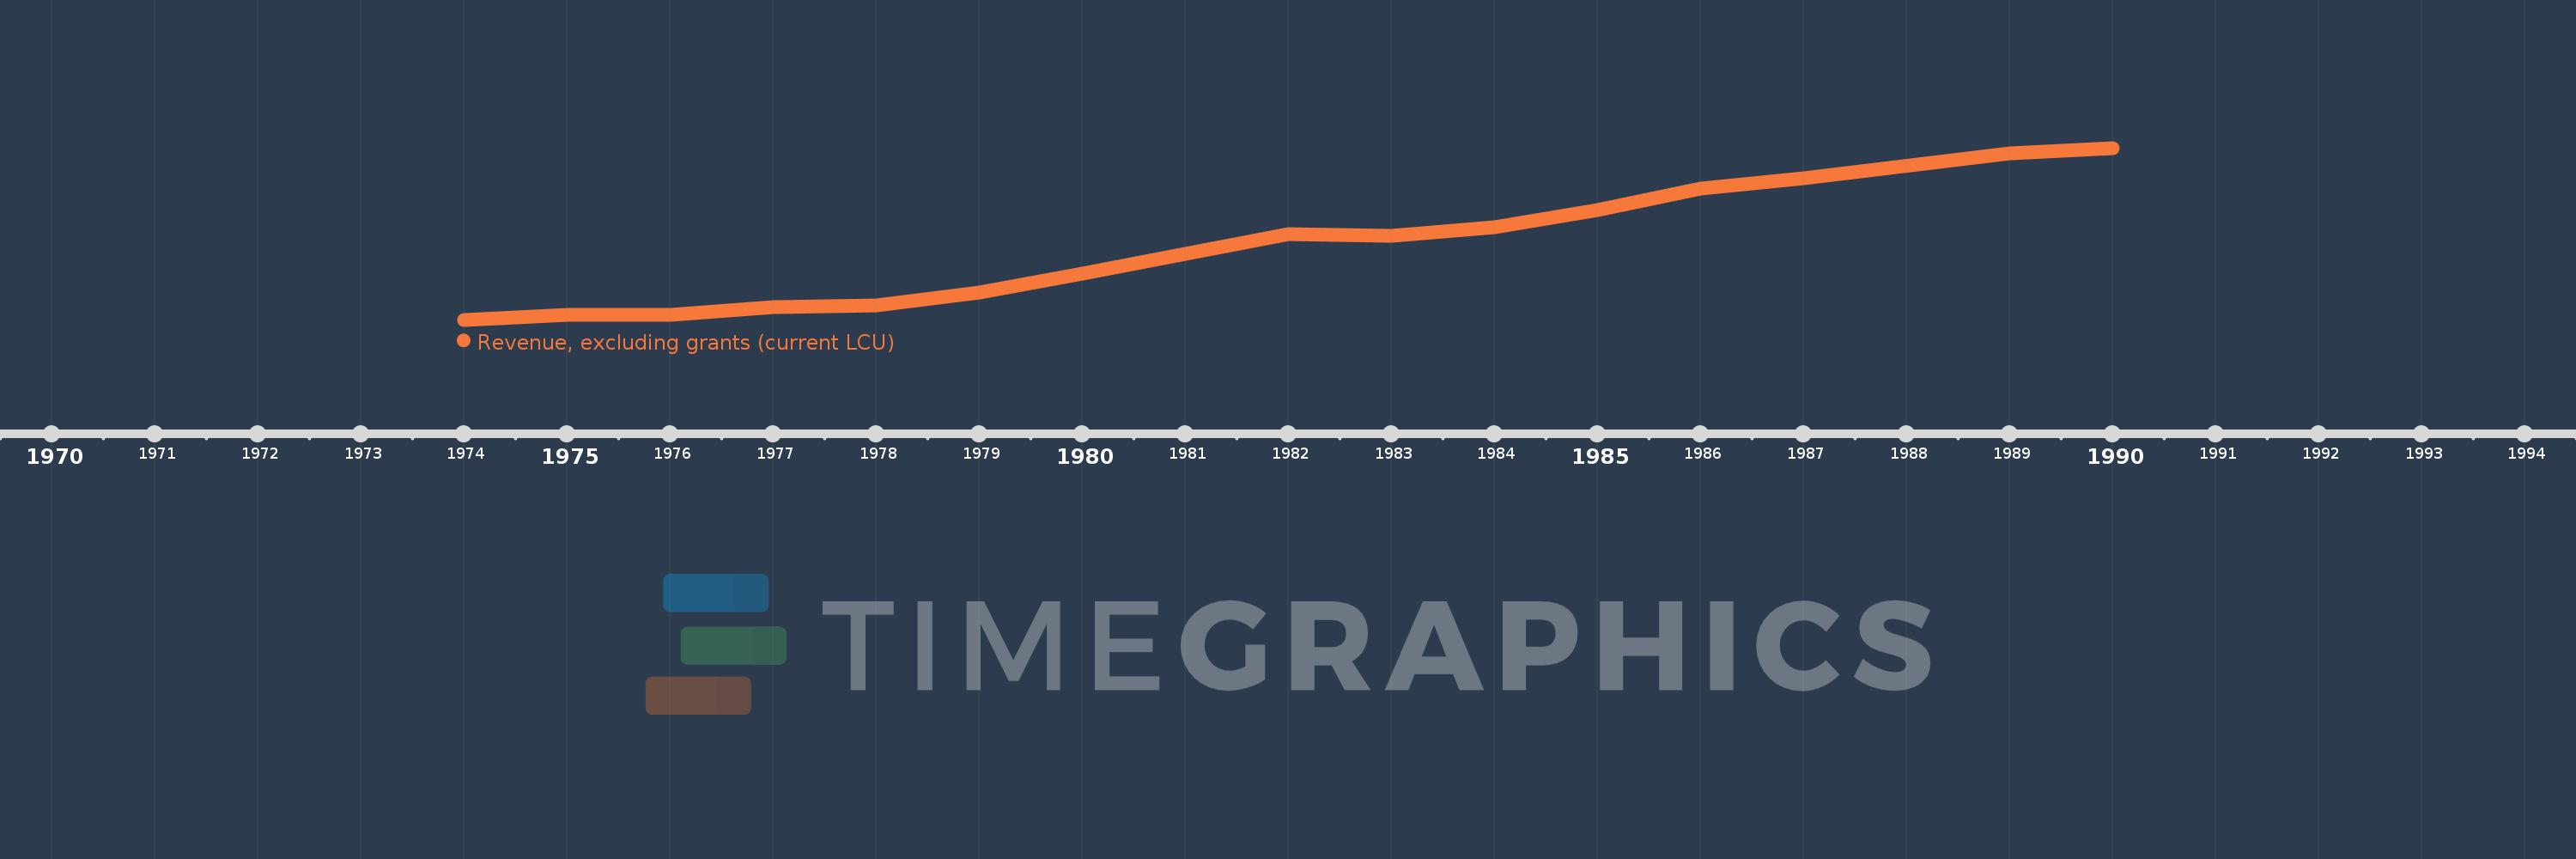
Revenue, excluding grants (current LCU)
1990,1989,1987,1986,1985,1984,1983,1982,1981,1980,1979,1978,1977,1976,1975,1974
This statistics in other country:
AfghanistanAlbaniaAlgeriaAngolaAntigua and BarbudaArgentinaArmeniaAustraliaAustriaAzerbaijanBahamas, TheBahrainBangladeshBarbadosBelarusBelgiumBelizeBeninBhutanBoliviaBosnia and HerzegovinaBotswanaBrazilBulgariaBurkina FasoBurundiCabo VerdeCambodiaCanadaCentral African RepublicChileChinaColombiaCongo, Dem. Rep.Congo, Rep.Costa RicaCote d'IvoireCroatiaCyprusCzech RepublicDenmarkDominicaDominican RepublicEgypt, Arab Rep.El SalvadorEquatorial GuineaEstoniaEthiopiaFijiFinlandFranceGambia, TheGeorgiaGermanyGhanaGreeceGrenadaGuatemalaHondurasHong Kong SAR, ChinaHungaryIcelandIndiaIndonesiaIran, Islamic Rep.IraqIrelandIsraelItalyJamaicaJapanJordanKazakhstanKenyaKiribatiKorea, Rep.KuwaitKyrgyz RepublicLao PDRLatviaLebanonLesothoLiberiaLithuaniaLuxembourgMacao SAR, ChinaMacedonia, FYRMadagascarMalawiMalaysiaMaldivesMaliMaltaMauritiusMexicoMicronesia, Fed. Sts.MoldovaMongoliaMoroccoMozambiqueMyanmarNamibiaNepalNetherlandsNew ZealandNicaraguaNigeriaNorwayOmanPakistanPanamaPapua New GuineaParaguayPeruPhilippinesPolandPortugalQatarRomaniaRussian FederationRwandaSamoaSan MarinoSao Tome and PrincipeSenegalSerbiaSeychellesSierra LeoneSingaporeSlovak RepublicSloveniaSolomon IslandsSouth AfricaSpainSri LankaSt. Kitts and NevisSt. LuciaSt. Vincent and the GrenadinesSurinameSwazilandSwedenSwitzerlandSyrian Arab RepublicTajikistanTanzaniaThailandTimor-LesteTogoTrinidad and TobagoTunisiaTurkeyUgandaUkraineUnited Arab EmiratesUnited KingdomUnited StatesUruguayVanuatuVenezuela, RBVietnamWest Bank and GazaYemen, Rep.ZambiaZimbabwe Timeline:
This timeline shows a graph from 1974 to 1990 of Bahamas, The. No data until 1973. Number of actual observations by date: 16.
Source name:
World Development Indicators
Source organization:
International Monetary Fund, Government Finance Statistics Yearbook and data files.
Categories, topics:
Public Sector
Last updated:
apr 23, 2017
Indicators value changes by year
Minimum:
107.6 mln
jan 1, 1974
Maximum:
457.2 mln
jan 1, 1990
At the date of observation
Value
Absolute change
Change from previous value
jan 1, 1974
107.6 mln
+107.6 mln
0.0%
jan 1, 1975
117.1 mln
+9.5 mln
8.83%
jan 1, 1976
118.2 mln
+1.1 mln
0.94%
jan 1, 1977
133.3 mln
+15.1 mln
12.77%
jan 1, 1978
136.8 mln
+3.5 mln
2.63%
jan 1, 1979
163.6 mln
+26.8 mln
19.59%
jan 1, 1980
201.4 mln
+37.8 mln
23.11%
jan 1, 1981
241.9 mln
+40.5 mln
20.11%
jan 1, 1982
281.8 mln
+39.9 mln
16.49%
jan 1, 1983
278.1 mln
-3.7 mln
-1.31%
jan 1, 1984
295.5 mln
+17.4 mln
6.26%
jan 1, 1985
331.1 mln
+35.6 mln
12.05%
jan 1, 1986
375.1 mln
+44.0 mln
13.29%
jan 1, 1987
395.7 mln
+20.6 mln
5.49%
jan 1, 1989
446.8 mln
+51.1 mln
12.91%
jan 1, 1990
457.2 mln
+10.4 mln
2.33%
Ranking of countries by current statistics by years


Comments: