29
/
en
AIzaSyAYiBZKx7MnpbEhh9jyipgxe19OcubqV5w
April 1, 2024
278221
Uruguay
URY
true
2
1
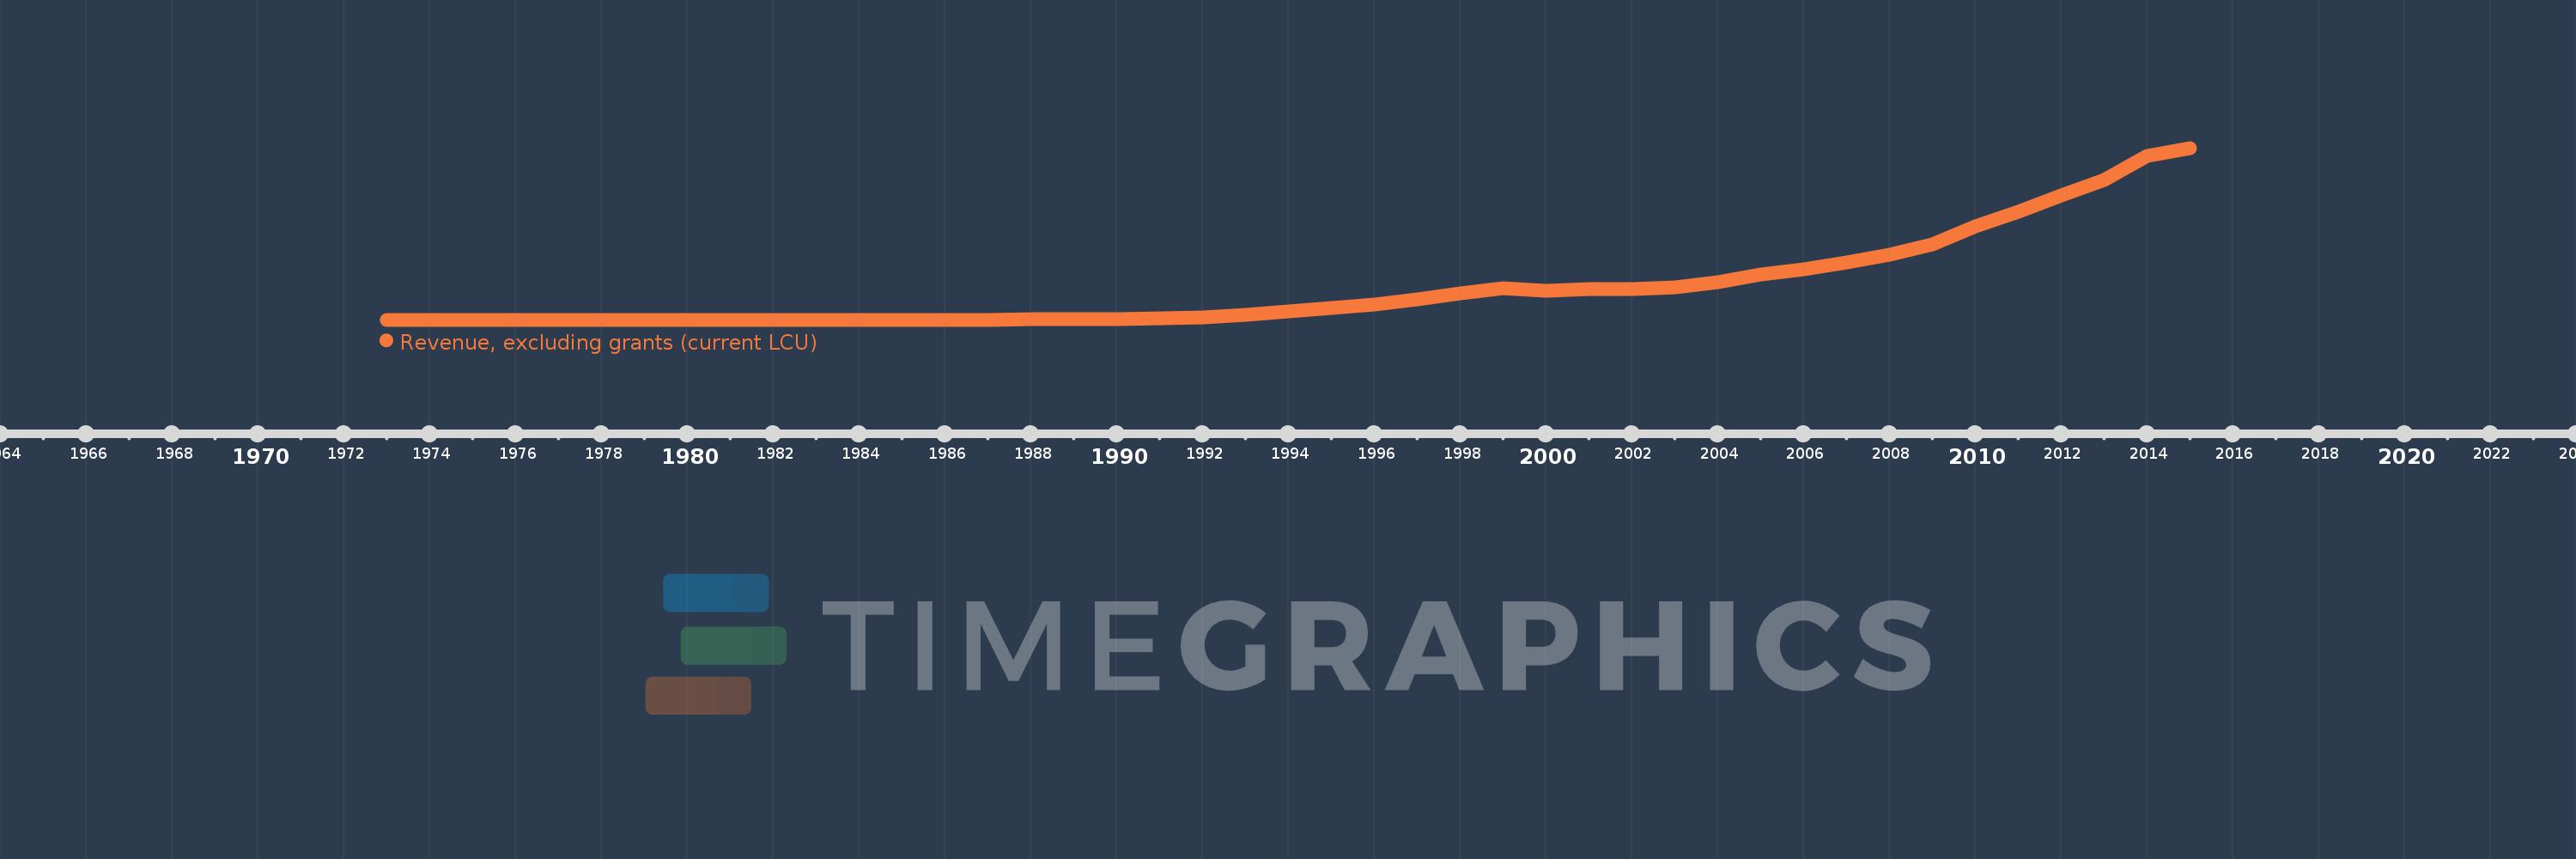
Revenue, excluding grants (current LCU)
2015,2014,2013,2012,2011,2010,2009,2008,2007,2006,2005,2004,2003,2002,2001,2000,1999,1998,1997,1996,1995,1994,1993,1992,1991,1990,1989,1988,1987,1986,1985,1984,1983,1982,1981,1980,1979,1978,1977,1976,1975,1974,1973
This statistics in other country:
AfghanistanAlbaniaAlgeriaAngolaAntigua and BarbudaArgentinaArmeniaAustraliaAustriaAzerbaijanBahamas, TheBahrainBangladeshBarbadosBelarusBelgiumBelizeBeninBhutanBoliviaBosnia and HerzegovinaBotswanaBrazilBulgariaBurkina FasoBurundiCabo VerdeCambodiaCanadaCentral African RepublicChileChinaColombiaCongo, Dem. Rep.Congo, Rep.Costa RicaCote d'IvoireCroatiaCyprusCzech RepublicDenmarkDominicaDominican RepublicEgypt, Arab Rep.El SalvadorEquatorial GuineaEstoniaEthiopiaFijiFinlandFranceGambia, TheGeorgiaGermanyGhanaGreeceGrenadaGuatemalaHondurasHong Kong SAR, ChinaHungaryIcelandIndiaIndonesiaIran, Islamic Rep.IraqIrelandIsraelItalyJamaicaJapanJordanKazakhstanKenyaKiribatiKorea, Rep.KuwaitKyrgyz RepublicLao PDRLatviaLebanonLesothoLiberiaLithuaniaLuxembourgMacao SAR, ChinaMacedonia, FYRMadagascarMalawiMalaysiaMaldivesMaliMaltaMauritiusMexicoMicronesia, Fed. Sts.MoldovaMongoliaMoroccoMozambiqueMyanmarNamibiaNepalNetherlandsNew ZealandNicaraguaNigeriaNorwayOmanPakistanPanamaPapua New GuineaParaguayPeruPhilippinesPolandPortugalQatarRomaniaRussian FederationRwandaSamoaSan MarinoSao Tome and PrincipeSenegalSerbiaSeychellesSierra LeoneSingaporeSlovak RepublicSloveniaSolomon IslandsSouth AfricaSpainSri LankaSt. Kitts and NevisSt. LuciaSt. Vincent and the GrenadinesSurinameSwazilandSwedenSwitzerlandSyrian Arab RepublicTajikistanTanzaniaThailandTimor-LesteTogoTrinidad and TobagoTunisiaTurkeyUgandaUkraineUnited Arab EmiratesUnited KingdomUnited StatesUruguayVanuatuVenezuela, RBVietnamWest Bank and GazaYemen, Rep.ZambiaZimbabwe Timeline:
This timeline shows a graph from 1973 to 2015 of Uruguay. No data until 1972. Number of actual observations by date: 43.
Source name:
World Development Indicators
Source organization:
International Monetary Fund, Government Finance Statistics Yearbook and data files.
Categories, topics:
Public Sector
Last updated:
apr 23, 2017
Indicators value changes by year
Minimum:
277.0K
jan 1, 1973
Maximum:
384.51 bln
jan 1, 2015
At the date of observation
Value
Absolute change
Change from previous value
jan 1, 1973
277.0K
+277.0K
0.0%
jan 1, 1974
550.0K
+273.0K
98.56%
jan 1, 1975
909.0K
+359.0K
65.27%
jan 1, 1976
1.513 mln
+604.0K
66.45%
jan 1, 1977
2.792 mln
+1.279 mln
84.53%
jan 1, 1978
4.51 mln
+1.718 mln
61.53%
jan 1, 1979
6.903 mln
+2.393 mln
53.06%
jan 1, 1980
12.102 mln
+5.199 mln
75.32%
jan 1, 1981
20.522 mln
+8.42 mln
69.58%
jan 1, 1982
29.072 mln
+8.55 mln
41.66%
jan 1, 1983
27.365 mln
-1.707 mln
-5.87%
jan 1, 1984
40.057 mln
+12.692 mln
46.38%
jan 1, 1985
55.376 mln
+15.319 mln
38.24%
jan 1, 1986
109.021 mln
+53.645 mln
96.87%
jan 1, 1987
219.625 mln
+110.604 mln
101.45%
jan 1, 1988
394.34 mln
+174.715 mln
79.55%
jan 1, 1989
666.998 mln
+272.658 mln
69.14%
jan 1, 1990
1.152 bln
+485.002 mln
72.71%
jan 1, 1991
2.593 bln
+1.441 bln
125.09%
jan 1, 1992
5.748 bln
+3.155 bln
121.67%
jan 1, 1993
10.396 bln
+4.648 bln
80.86%
jan 1, 1994
17.753 bln
+7.357 bln
70.77%
jan 1, 1995
26.339 bln
+8.586 bln
48.36%
jan 1, 1996
33.793 bln
+7.454 bln
28.3%
jan 1, 1997
45.29 bln
+11.497 bln
34.02%
jan 1, 1998
59.741 bln
+14.451 bln
31.91%
jan 1, 1999
70.389 bln
+10.648 bln
17.82%
jan 1, 2000
65.604 bln
-4.785 bln
-6.8%
jan 1, 2001
68.156 bln
+2.552 bln
3.89%
jan 1, 2002
69.169 bln
+1.013 bln
1.49%
jan 1, 2003
71.656 bln
+2.487 bln
3.6%
jan 1, 2004
84.501 bln
+12.845 bln
17.93%
jan 1, 2005
100.589 bln
+16.087 bln
19.04%
jan 1, 2006
111.941 bln
+11.352 bln
11.29%
jan 1, 2007
128.963 bln
+17.023 bln
15.21%
jan 1, 2008
145.65 bln
+16.686 bln
12.94%
jan 1, 2009
168.65 bln
+23.0 bln
15.79%
jan 1, 2010
208.841 bln
+40.191 bln
23.83%
jan 1, 2011
241.696 bln
+32.856 bln
15.73%
jan 1, 2012
278.123 bln
+36.427 bln
15.07%
jan 1, 2013
312.077 bln
+33.954 bln
12.21%
jan 1, 2014
366.411 bln
+54.334 bln
17.41%
jan 1, 2015
384.51 bln
+18.099 bln
4.94%
Ranking of countries by current statistics by years


Comments: