29
/
en
AIzaSyAYiBZKx7MnpbEhh9jyipgxe19OcubqV5w
April 1, 2024
181583
Lithuania
LTU
true
2
1
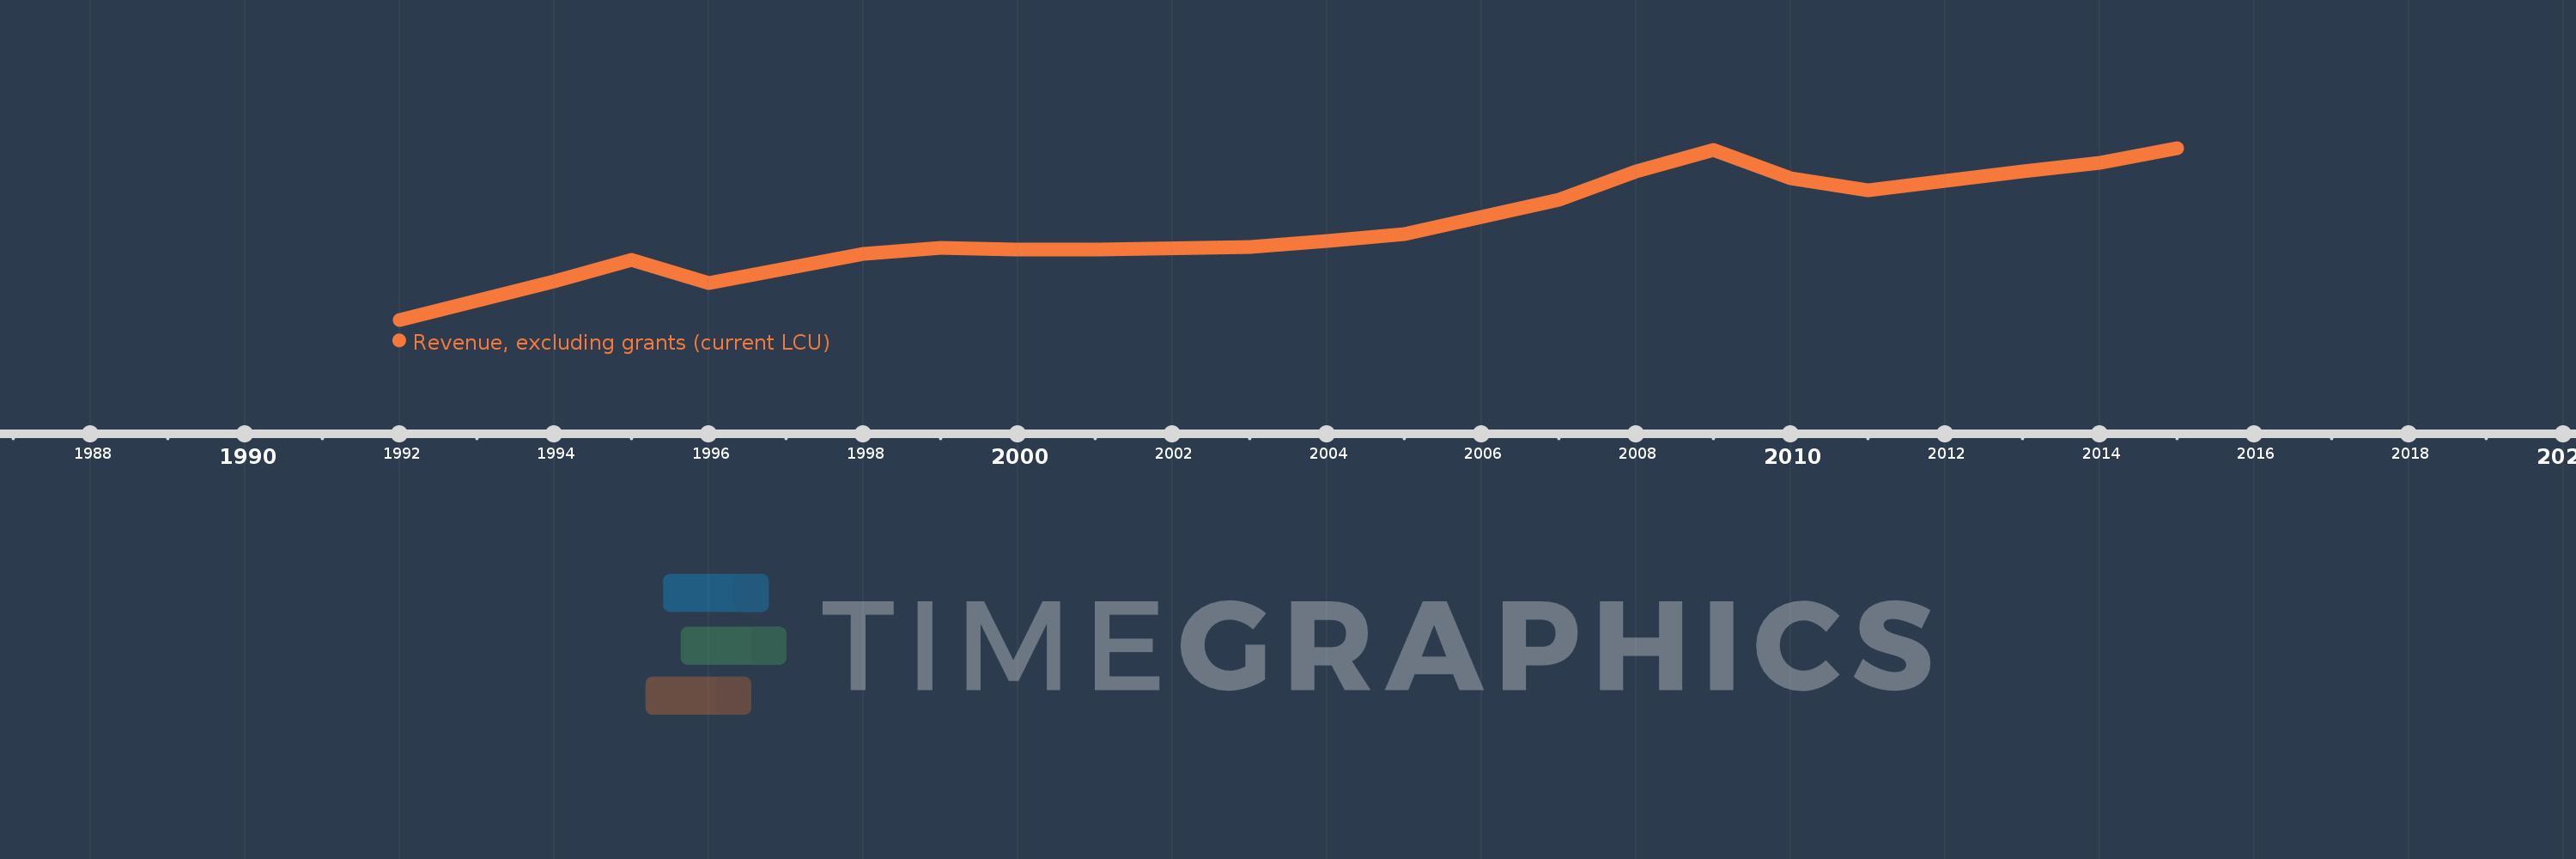
Revenue, excluding grants (current LCU)
2015,2014,2013,2012,2011,2010,2009,2008,2007,2006,2005,2004,2003,2001,2000,1999,1998,1996,1995,1994,1992
This statistics in other country:
AfghanistanAlbaniaAlgeriaAngolaAntigua and BarbudaArgentinaArmeniaAustraliaAustriaAzerbaijanBahamas, TheBahrainBangladeshBarbadosBelarusBelgiumBelizeBeninBhutanBoliviaBosnia and HerzegovinaBotswanaBrazilBulgariaBurkina FasoBurundiCabo VerdeCambodiaCanadaCentral African RepublicChileChinaColombiaCongo, Dem. Rep.Congo, Rep.Costa RicaCote d'IvoireCroatiaCyprusCzech RepublicDenmarkDominicaDominican RepublicEgypt, Arab Rep.El SalvadorEquatorial GuineaEstoniaEthiopiaFijiFinlandFranceGambia, TheGeorgiaGermanyGhanaGreeceGrenadaGuatemalaHondurasHong Kong SAR, ChinaHungaryIcelandIndiaIndonesiaIran, Islamic Rep.IraqIrelandIsraelItalyJamaicaJapanJordanKazakhstanKenyaKiribatiKorea, Rep.KuwaitKyrgyz RepublicLao PDRLatviaLebanonLesothoLiberiaLithuaniaLuxembourgMacao SAR, ChinaMacedonia, FYRMadagascarMalawiMalaysiaMaldivesMaliMaltaMauritiusMexicoMicronesia, Fed. Sts.MoldovaMongoliaMoroccoMozambiqueMyanmarNamibiaNepalNetherlandsNew ZealandNicaraguaNigeriaNorwayOmanPakistanPanamaPapua New GuineaParaguayPeruPhilippinesPolandPortugalQatarRomaniaRussian FederationRwandaSamoaSan MarinoSao Tome and PrincipeSenegalSerbiaSeychellesSierra LeoneSingaporeSlovak RepublicSloveniaSolomon IslandsSouth AfricaSpainSri LankaSt. Kitts and NevisSt. LuciaSt. Vincent and the GrenadinesSurinameSwazilandSwedenSwitzerlandSyrian Arab RepublicTajikistanTanzaniaThailandTimor-LesteTogoTrinidad and TobagoTunisiaTurkeyUgandaUkraineUnited Arab EmiratesUnited KingdomUnited StatesUruguayVanuatuVenezuela, RBVietnamWest Bank and GazaYemen, Rep.ZambiaZimbabwe Timeline:
This timeline shows a graph from 1992 to 2015 of Lithuania. No data until 1991. Number of actual observations by date: 21.
Source name:
World Development Indicators
Source organization:
International Monetary Fund, Government Finance Statistics Yearbook and data files.
Categories, topics:
Public Sector
Last updated:
apr 23, 2017
Indicators value changes by year
Minimum:
38.599 mln
jan 1, 1992
Maximum:
3.263 bln
jan 1, 2015
At the date of observation
Value
Absolute change
Change from previous value
jan 1, 1992
38.599 mln
+38.599 mln
0.0%
jan 1, 1994
752.433 mln
+713.834 mln
1.85K%
jan 1, 1995
1.156 bln
+403.238 mln
53.59%
jan 1, 1996
719.769 mln
-435.901 mln
-37.72%
jan 1, 1998
1.268 bln
+548.181 mln
76.16%
jan 1, 1999
1.395 bln
+127.247 mln
10.04%
jan 1, 2000
1.351 bln
-44.555 mln
-3.19%
jan 1, 2001
1.358 bln
+7.533 mln
0.56%
jan 1, 2003
1.403 bln
+44.694 mln
3.29%
jan 1, 2004
1.519 bln
+116.019 mln
8.27%
jan 1, 2005
1.65 bln
+130.931 mln
8.62%
jan 1, 2006
1.971 bln
+321.139 mln
19.47%
jan 1, 2007
2.297 bln
+325.854 mln
16.53%
jan 1, 2008
2.824 bln
+526.897 mln
22.94%
jan 1, 2009
3.223 bln
+399.296 mln
14.14%
jan 1, 2010
2.702 bln
-521.458 mln
-16.18%
jan 1, 2011
2.476 bln
-225.458 mln
-8.35%
jan 1, 2012
2.644 bln
+168.11 mln
6.79%
jan 1, 2013
2.82 bln
+175.336 mln
6.63%
jan 1, 2014
2.982 bln
+162.164 mln
5.75%
jan 1, 2015
3.263 bln
+281.276 mln
9.43%
Ranking of countries by current statistics by years


Comments: