29
/
en
AIzaSyAYiBZKx7MnpbEhh9jyipgxe19OcubqV5w
April 1, 2024
282959
Vietnam
VNM
true
2
1
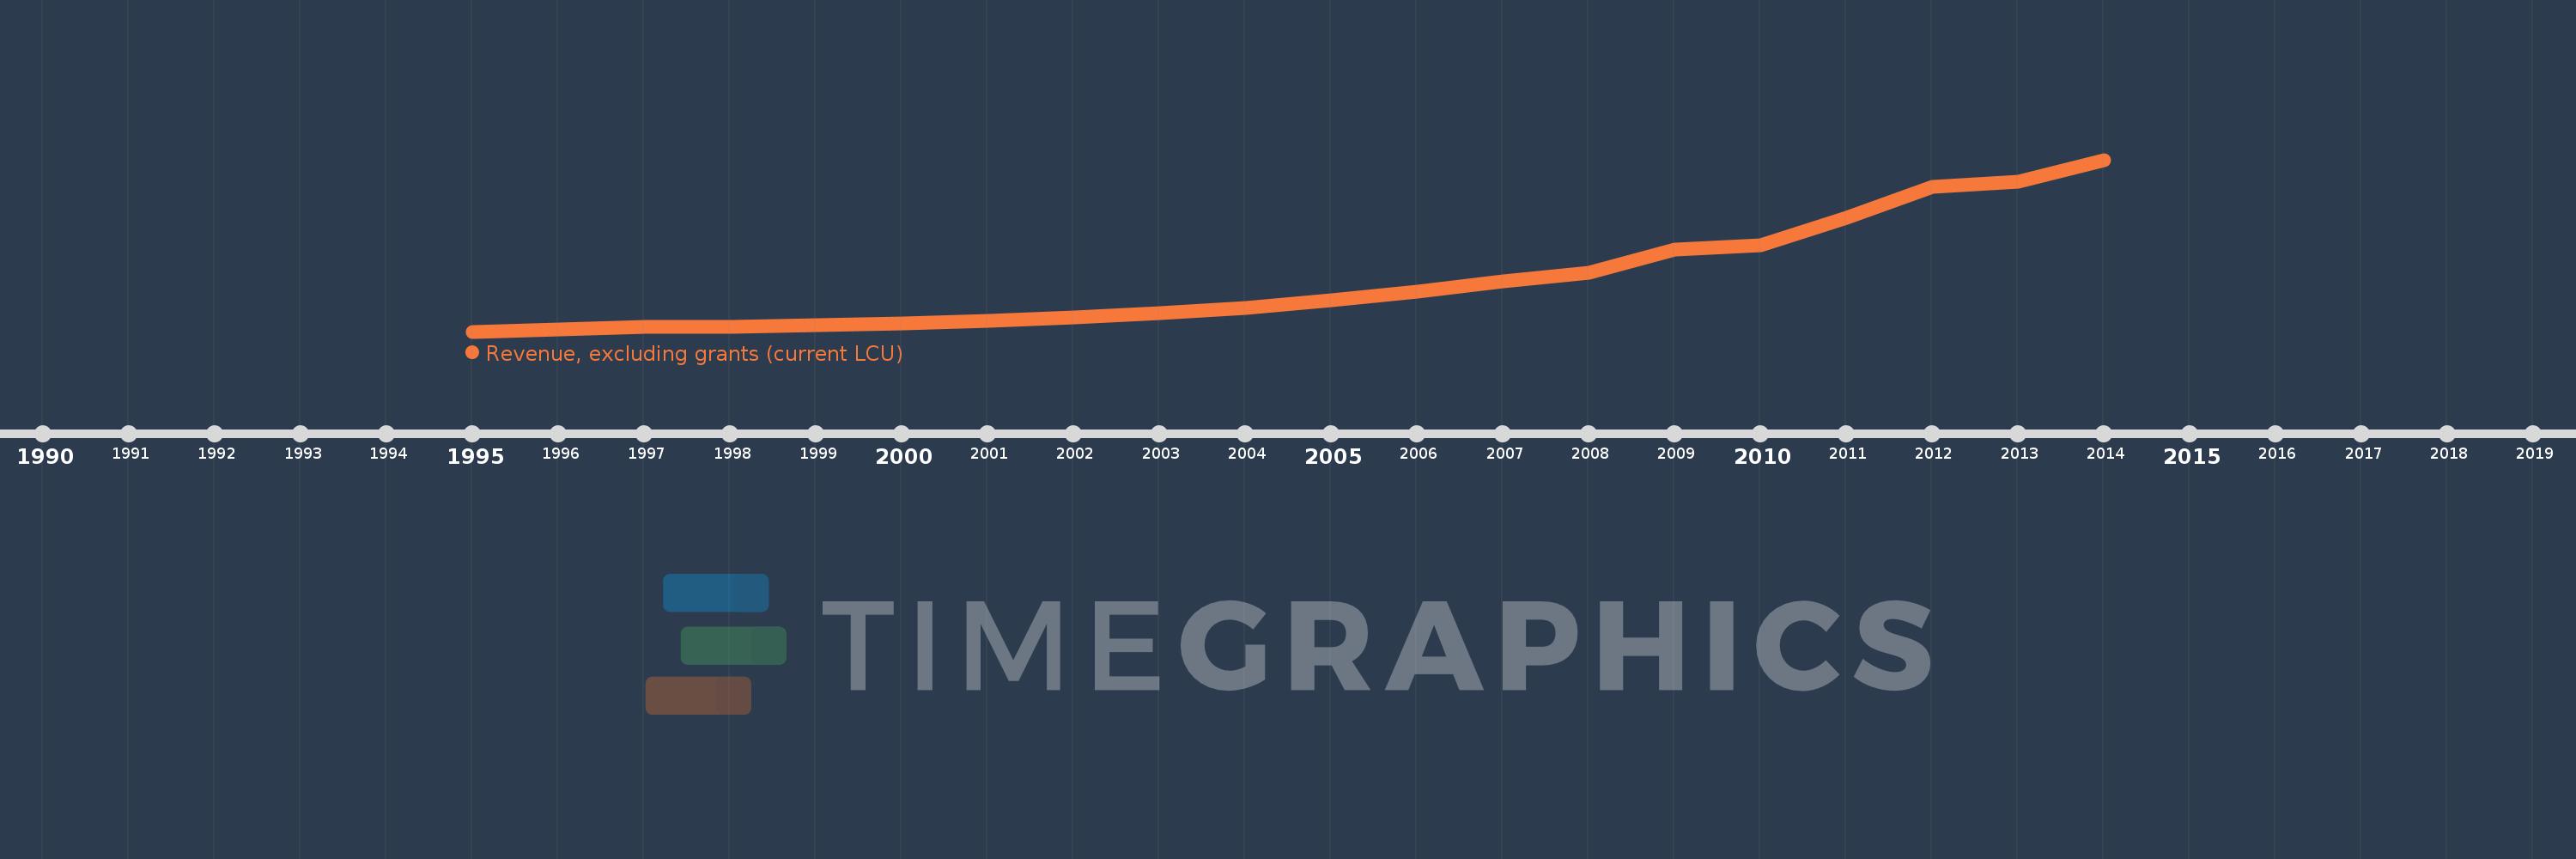
Revenue, excluding grants (current LCU)
2014,2013,2012,2011,2010,2009,2008,2007,2006,2005,2004,2003,2002,2001,2000,1999,1998,1997,1996,1995
This statistics in other country:
AfghanistanAlbaniaAlgeriaAngolaAntigua and BarbudaArgentinaArmeniaAustraliaAustriaAzerbaijanBahamas, TheBahrainBangladeshBarbadosBelarusBelgiumBelizeBeninBhutanBoliviaBosnia and HerzegovinaBotswanaBrazilBulgariaBurkina FasoBurundiCabo VerdeCambodiaCanadaCentral African RepublicChileChinaColombiaCongo, Dem. Rep.Congo, Rep.Costa RicaCote d'IvoireCroatiaCyprusCzech RepublicDenmarkDominicaDominican RepublicEgypt, Arab Rep.El SalvadorEquatorial GuineaEstoniaEthiopiaFijiFinlandFranceGambia, TheGeorgiaGermanyGhanaGreeceGrenadaGuatemalaHondurasHong Kong SAR, ChinaHungaryIcelandIndiaIndonesiaIran, Islamic Rep.IraqIrelandIsraelItalyJamaicaJapanJordanKazakhstanKenyaKiribatiKorea, Rep.KuwaitKyrgyz RepublicLao PDRLatviaLebanonLesothoLiberiaLithuaniaLuxembourgMacao SAR, ChinaMacedonia, FYRMadagascarMalawiMalaysiaMaldivesMaliMaltaMauritiusMexicoMicronesia, Fed. Sts.MoldovaMongoliaMoroccoMozambiqueMyanmarNamibiaNepalNetherlandsNew ZealandNicaraguaNigeriaNorwayOmanPakistanPanamaPapua New GuineaParaguayPeruPhilippinesPolandPortugalQatarRomaniaRussian FederationRwandaSamoaSan MarinoSao Tome and PrincipeSenegalSerbiaSeychellesSierra LeoneSingaporeSlovak RepublicSloveniaSolomon IslandsSouth AfricaSpainSri LankaSt. Kitts and NevisSt. LuciaSt. Vincent and the GrenadinesSurinameSwazilandSwedenSwitzerlandSyrian Arab RepublicTajikistanTanzaniaThailandTimor-LesteTogoTrinidad and TobagoTunisiaTurkeyUgandaUkraineUnited Arab EmiratesUnited KingdomUnited StatesUruguayVanuatuVenezuela, RBVietnamWest Bank and GazaYemen, Rep.ZambiaZimbabwe Timeline:
This timeline shows a graph from 1995 to 2014 of Vietnam. No data until 1994. Number of actual observations by date: 20.
Source name:
World Development Indicators
Source organization:
International Monetary Fund, Government Finance Statistics Yearbook and data files.
Categories, topics:
Public Sector
Last updated:
apr 23, 2017
Indicators value changes by year
Minimum:
40.905 trl
jan 1, 1995
Maximum:
770.83 trl
jan 1, 2014
At the date of observation
Value
Absolute change
Change from previous value
jan 1, 1995
40.905 trl
+40.905 trl
0.0%
jan 1, 1996
51.527 trl
+10.622 trl
25.97%
jan 1, 1997
60.472 trl
+8.945 trl
17.36%
jan 1, 1998
61.933 trl
+1.461 trl
2.42%
jan 1, 1999
70.0 trl
+8.067 trl
13.03%
jan 1, 2000
75.357 trl
+5.357 trl
7.65%
jan 1, 2001
87.883 trl
+12.526 trl
16.62%
jan 1, 2002
100.918 trl
+13.035 trl
14.83%
jan 1, 2003
118.346 trl
+17.428 trl
17.27%
jan 1, 2004
140.04 trl
+21.694 trl
18.33%
jan 1, 2005
172.512 trl
+32.472 trl
23.19%
jan 1, 2006
209.04 trl
+36.528 trl
21.17%
jan 1, 2007
254.166 trl
+45.126 trl
21.59%
jan 1, 2008
290.734 trl
+36.568 trl
14.39%
jan 1, 2009
388.25 trl
+97.516 trl
33.54%
jan 1, 2010
407.29 trl
+19.04 trl
4.9%
jan 1, 2011
524.998 trl
+117.708 trl
28.9%
jan 1, 2012
655.476 trl
+130.478 trl
24.85%
jan 1, 2013
677.713 trl
+22.237 trl
3.39%
jan 1, 2014
770.83 trl
+93.117 trl
13.74%
Ranking of countries by current statistics by years


Comments: