29
/
en
AIzaSyAYiBZKx7MnpbEhh9jyipgxe19OcubqV5w
April 1, 2024
189589
Maldives
MDV
true
2
1
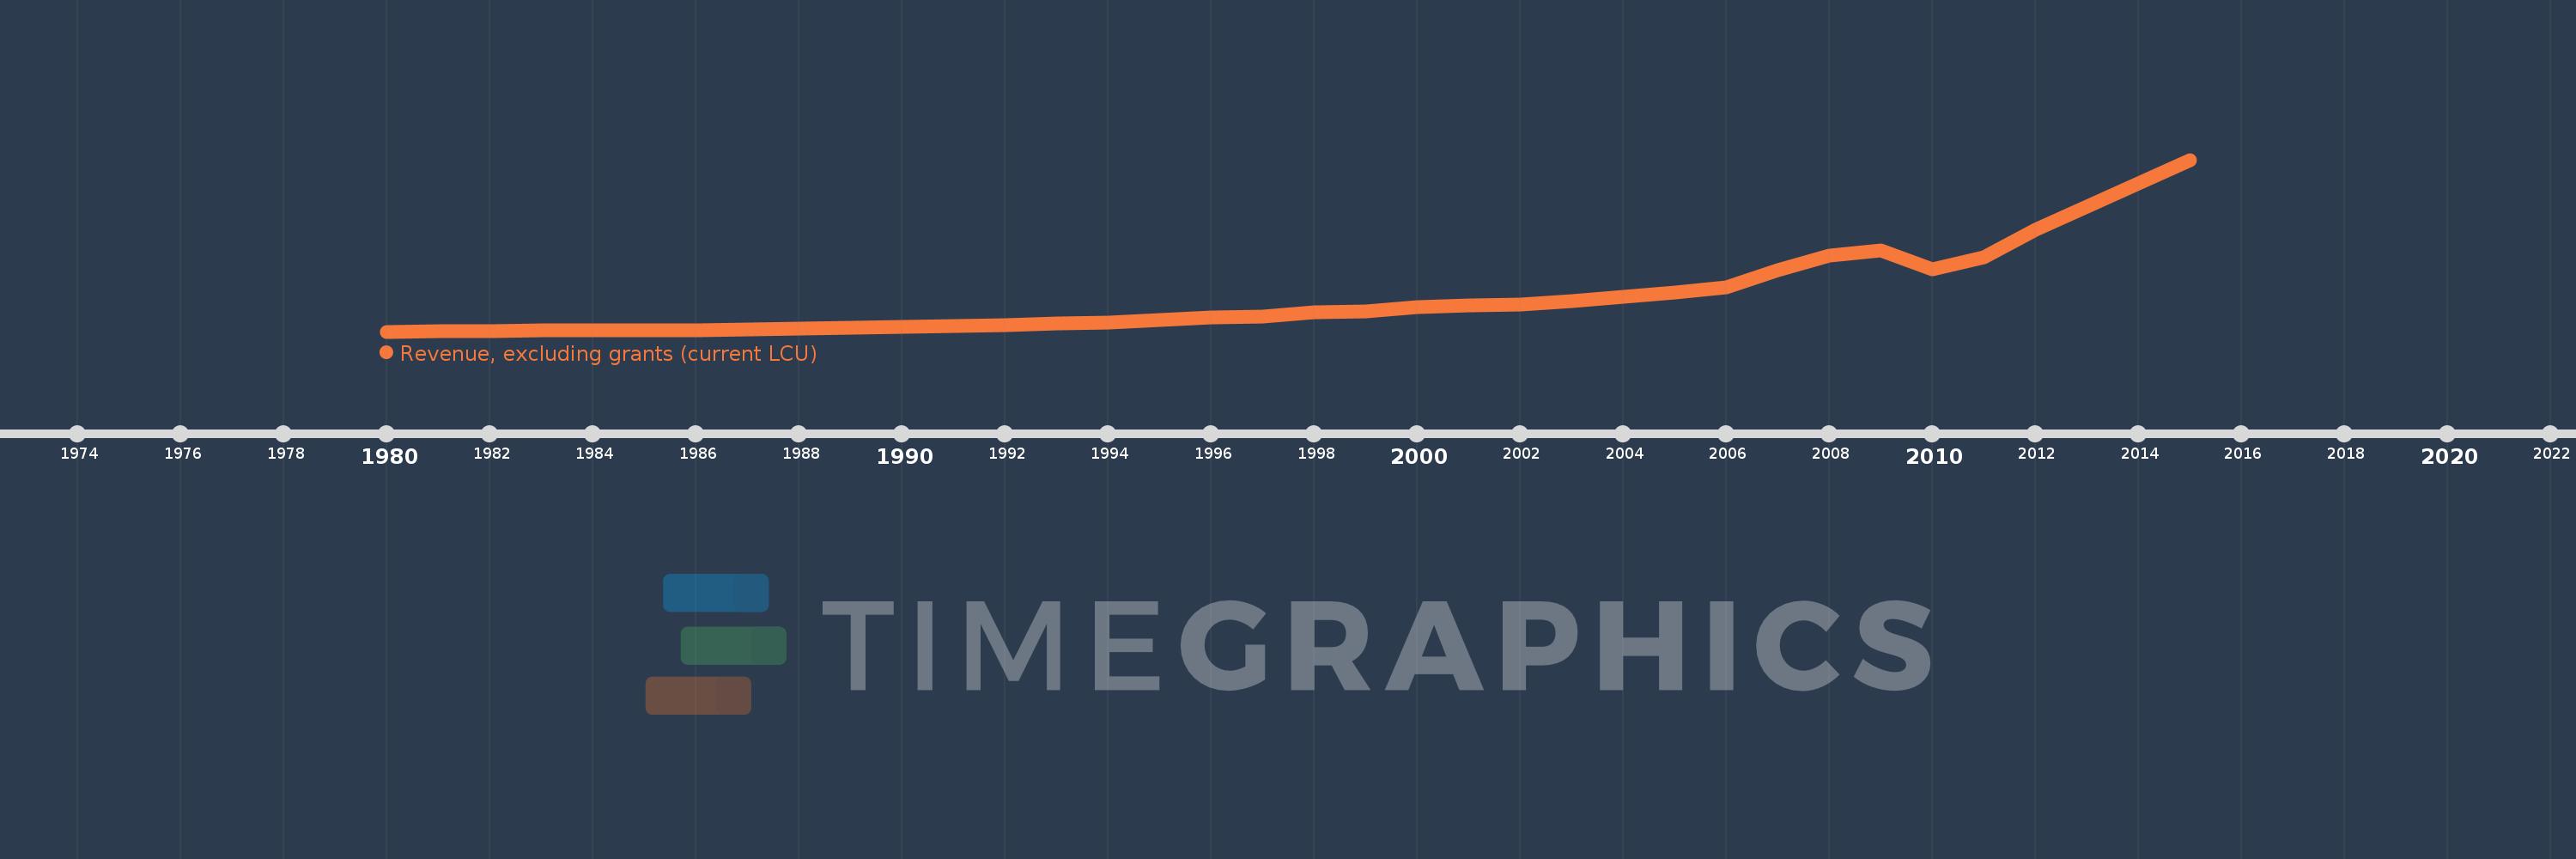
Revenue, excluding grants (current LCU)
2015,2012,2011,2010,2009,2008,2007,2006,2005,2004,2003,2002,2001,2000,1999,1998,1997,1996,1995,1994,1993,1992,1991,1990,1989,1988,1987,1986,1985,1984,1983,1982,1981,1980
This statistics in other country:
AfghanistanAlbaniaAlgeriaAngolaAntigua and BarbudaArgentinaArmeniaAustraliaAustriaAzerbaijanBahamas, TheBahrainBangladeshBarbadosBelarusBelgiumBelizeBeninBhutanBoliviaBosnia and HerzegovinaBotswanaBrazilBulgariaBurkina FasoBurundiCabo VerdeCambodiaCanadaCentral African RepublicChileChinaColombiaCongo, Dem. Rep.Congo, Rep.Costa RicaCote d'IvoireCroatiaCyprusCzech RepublicDenmarkDominicaDominican RepublicEgypt, Arab Rep.El SalvadorEquatorial GuineaEstoniaEthiopiaFijiFinlandFranceGambia, TheGeorgiaGermanyGhanaGreeceGrenadaGuatemalaHondurasHong Kong SAR, ChinaHungaryIcelandIndiaIndonesiaIran, Islamic Rep.IraqIrelandIsraelItalyJamaicaJapanJordanKazakhstanKenyaKiribatiKorea, Rep.KuwaitKyrgyz RepublicLao PDRLatviaLebanonLesothoLiberiaLithuaniaLuxembourgMacao SAR, ChinaMacedonia, FYRMadagascarMalawiMalaysiaMaldivesMaliMaltaMauritiusMexicoMicronesia, Fed. Sts.MoldovaMongoliaMoroccoMozambiqueMyanmarNamibiaNepalNetherlandsNew ZealandNicaraguaNigeriaNorwayOmanPakistanPanamaPapua New GuineaParaguayPeruPhilippinesPolandPortugalQatarRomaniaRussian FederationRwandaSamoaSan MarinoSao Tome and PrincipeSenegalSerbiaSeychellesSierra LeoneSingaporeSlovak RepublicSloveniaSolomon IslandsSouth AfricaSpainSri LankaSt. Kitts and NevisSt. LuciaSt. Vincent and the GrenadinesSurinameSwazilandSwedenSwitzerlandSyrian Arab RepublicTajikistanTanzaniaThailandTimor-LesteTogoTrinidad and TobagoTunisiaTurkeyUgandaUkraineUnited Arab EmiratesUnited KingdomUnited StatesUruguayVanuatuVenezuela, RBVietnamWest Bank and GazaYemen, Rep.ZambiaZimbabwe Timeline:
This timeline shows a graph from 1980 to 2015 of Maldives. No data until 1979. Number of actual observations by date: 34.
Source name:
World Development Indicators
Source organization:
International Monetary Fund, Government Finance Statistics Yearbook and data files.
Categories, topics:
Public Sector
Last updated:
apr 23, 2017
Indicators value changes by year
Minimum:
16.0 mln
jan 1, 1980
Maximum:
14.587 bln
jan 1, 2015
At the date of observation
Value
Absolute change
Change from previous value
jan 1, 1980
16.0 mln
+16.0 mln
0.0%
jan 1, 1981
45.5 mln
+29.5 mln
184.38%
jan 1, 1982
71.5 mln
+26.0 mln
57.14%
jan 1, 1983
92.0 mln
+20.5 mln
28.67%
jan 1, 1984
108.5 mln
+16.5 mln
17.93%
jan 1, 1985
128.3 mln
+19.8 mln
18.25%
jan 1, 1986
149.1 mln
+20.8 mln
16.21%
jan 1, 1987
179.1 mln
+30.0 mln
20.12%
jan 1, 1988
266.9 mln
+87.8 mln
49.02%
jan 1, 1989
312.6 mln
+45.7 mln
17.12%
jan 1, 1990
404.6 mln
+92.0 mln
29.43%
jan 1, 1991
454.8 mln
+50.2 mln
12.41%
jan 1, 1992
567.7 mln
+112.9 mln
24.82%
jan 1, 1993
682.9 mln
+115.2 mln
20.29%
jan 1, 1994
764.2 mln
+81.3 mln
11.91%
jan 1, 1995
979.7 mln
+215.5 mln
28.2%
jan 1, 1996
1.206 bln
+226.1 mln
23.08%
jan 1, 1997
1.322 bln
+115.8 mln
9.6%
jan 1, 1998
1.652 bln
+330.4 mln
25.0%
jan 1, 1999
1.764 bln
+111.6 mln
6.76%
jan 1, 2000
2.059 bln
+295.0 mln
16.73%
jan 1, 2001
2.203 bln
+144.0 mln
7.0%
jan 1, 2002
2.294 bln
+91.7 mln
4.16%
jan 1, 2003
2.578 bln
+283.6 mln
12.36%
jan 1, 2004
2.937 bln
+358.9 mln
13.92%
jan 1, 2005
3.331 bln
+394.3 mln
13.43%
jan 1, 2006
3.753 bln
+422.2 mln
12.67%
jan 1, 2007
5.237 bln
+1.484 bln
39.54%
jan 1, 2008
6.491 bln
+1.253 bln
23.93%
jan 1, 2009
6.897 bln
+406.5 mln
6.26%
jan 1, 2010
5.299 bln
-1.598 bln
-23.17%
jan 1, 2011
6.343 bln
+1.044 bln
19.69%
jan 1, 2012
8.638 bln
+2.295 bln
36.17%
jan 1, 2015
14.587 bln
+5.949 bln
68.88%
Ranking of countries by current statistics by years


Comments: