29
/
en
AIzaSyAYiBZKx7MnpbEhh9jyipgxe19OcubqV5w
April 1, 2024
188454
Malaysia
MYS
true
2
1
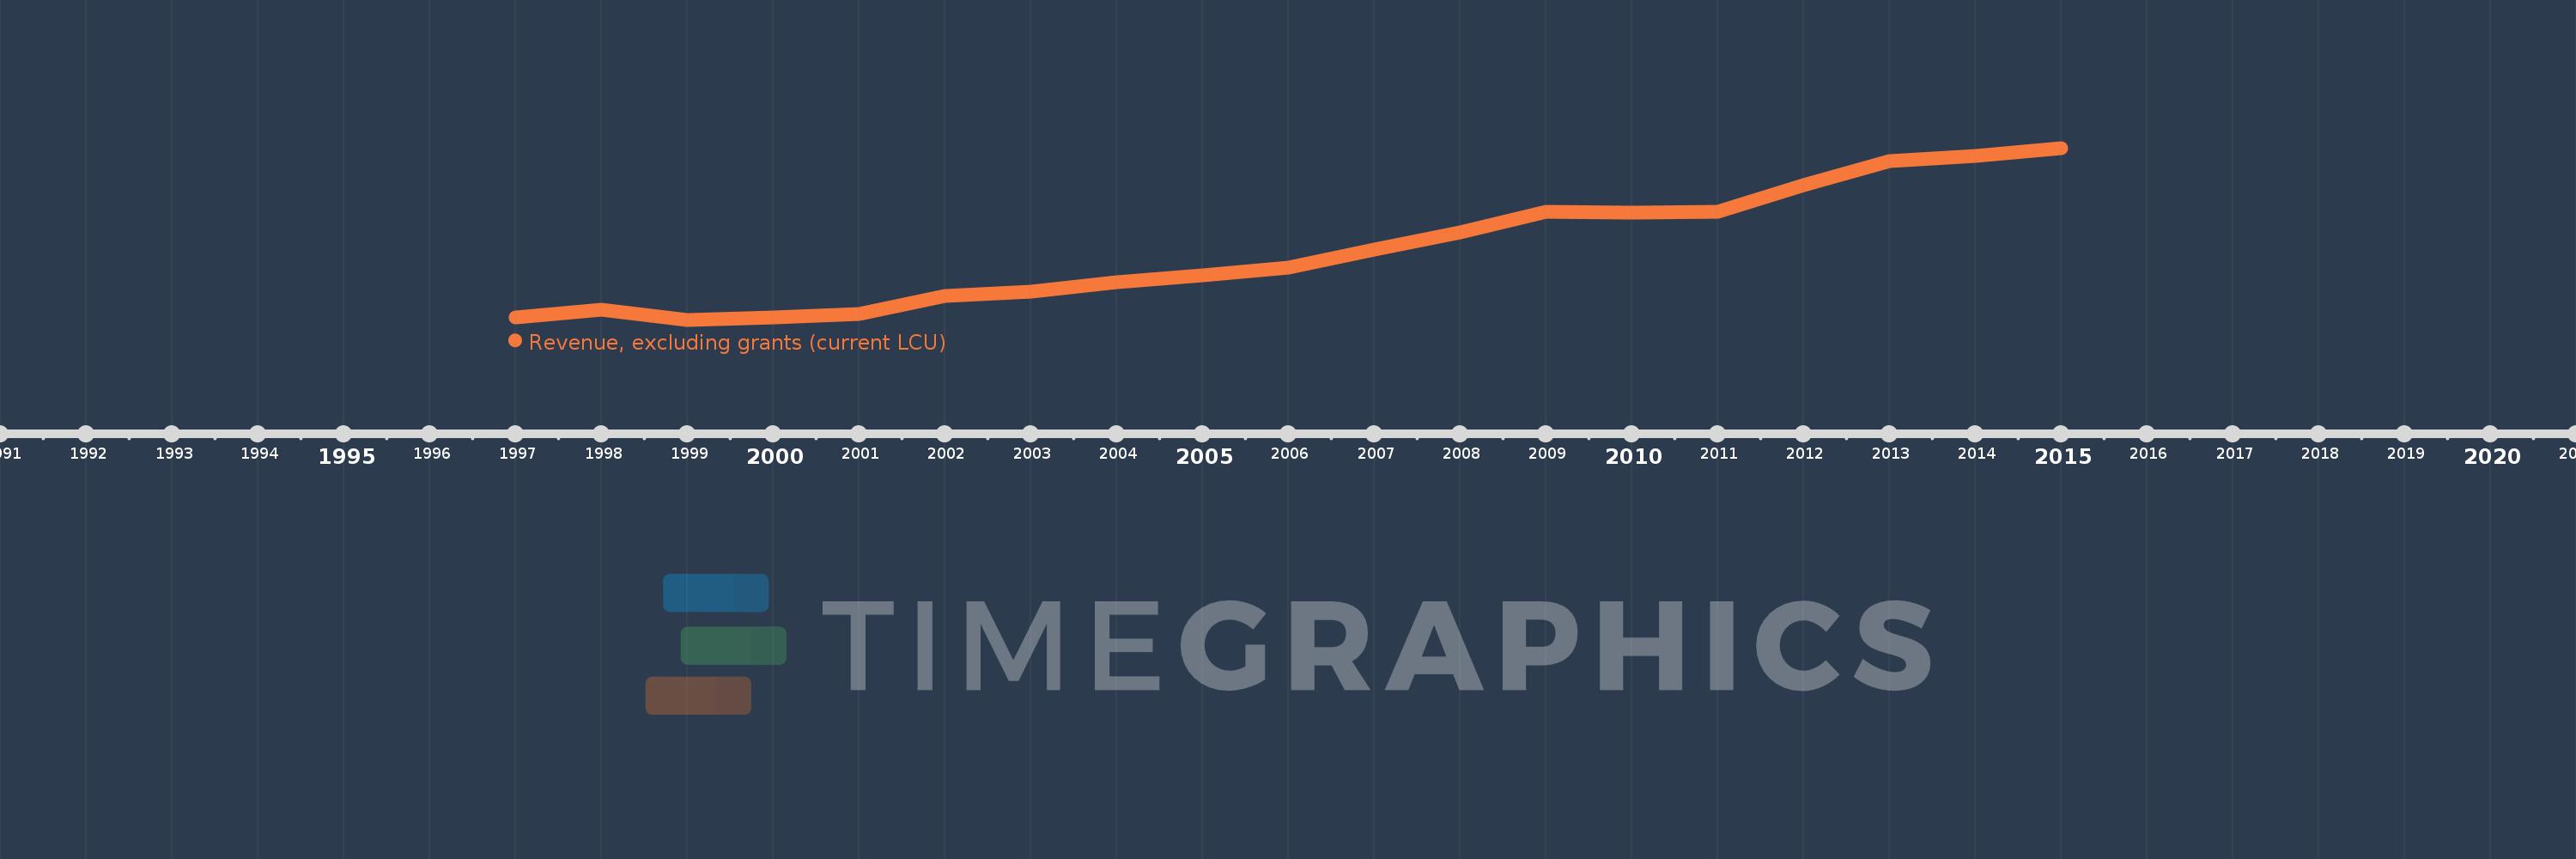
Revenue, excluding grants (current LCU)
2015,2014,2013,2012,2011,2010,2009,2008,2007,2006,2005,2004,2003,2002,2001,2000,1999,1998,1997
This statistics in other country:
AfghanistanAlbaniaAlgeriaAngolaAntigua and BarbudaArgentinaArmeniaAustraliaAustriaAzerbaijanBahamas, TheBahrainBangladeshBarbadosBelarusBelgiumBelizeBeninBhutanBoliviaBosnia and HerzegovinaBotswanaBrazilBulgariaBurkina FasoBurundiCabo VerdeCambodiaCanadaCentral African RepublicChileChinaColombiaCongo, Dem. Rep.Congo, Rep.Costa RicaCote d'IvoireCroatiaCyprusCzech RepublicDenmarkDominicaDominican RepublicEgypt, Arab Rep.El SalvadorEquatorial GuineaEstoniaEthiopiaFijiFinlandFranceGambia, TheGeorgiaGermanyGhanaGreeceGrenadaGuatemalaHondurasHong Kong SAR, ChinaHungaryIcelandIndiaIndonesiaIran, Islamic Rep.IraqIrelandIsraelItalyJamaicaJapanJordanKazakhstanKenyaKiribatiKorea, Rep.KuwaitKyrgyz RepublicLao PDRLatviaLebanonLesothoLiberiaLithuaniaLuxembourgMacao SAR, ChinaMacedonia, FYRMadagascarMalawiMalaysiaMaldivesMaliMaltaMauritiusMexicoMicronesia, Fed. Sts.MoldovaMongoliaMoroccoMozambiqueMyanmarNamibiaNepalNetherlandsNew ZealandNicaraguaNigeriaNorwayOmanPakistanPanamaPapua New GuineaParaguayPeruPhilippinesPolandPortugalQatarRomaniaRussian FederationRwandaSamoaSan MarinoSao Tome and PrincipeSenegalSerbiaSeychellesSierra LeoneSingaporeSlovak RepublicSloveniaSolomon IslandsSouth AfricaSpainSri LankaSt. Kitts and NevisSt. LuciaSt. Vincent and the GrenadinesSurinameSwazilandSwedenSwitzerlandSyrian Arab RepublicTajikistanTanzaniaThailandTimor-LesteTogoTrinidad and TobagoTunisiaTurkeyUgandaUkraineUnited Arab EmiratesUnited KingdomUnited StatesUruguayVanuatuVenezuela, RBVietnamWest Bank and GazaYemen, Rep.ZambiaZimbabwe Timeline:
This timeline shows a graph from 1997 to 2015 of Malaysia. No data until 1996. Number of actual observations by date: 19.
Source name:
World Development Indicators
Source organization:
International Monetary Fund, Government Finance Statistics Yearbook and data files.
Categories, topics:
Public Sector
Last updated:
apr 23, 2017
Indicators value changes by year
Minimum:
56.823 bln
jan 1, 1999
Maximum:
220.625 bln
jan 1, 2015
At the date of observation
Value
Absolute change
Change from previous value
jan 1, 1997
59.058 bln
+59.058 bln
0.0%
jan 1, 1998
66.06 bln
+7.002 bln
11.86%
jan 1, 1999
56.823 bln
-9.237 bln
-13.98%
jan 1, 2000
59.088 bln
+2.265 bln
3.99%
jan 1, 2001
62.291 bln
+3.203 bln
5.42%
jan 1, 2002
79.915 bln
+17.624 bln
28.29%
jan 1, 2003
83.514 bln
+3.599 bln
4.5%
jan 1, 2004
92.608 bln
+9.094 bln
10.89%
jan 1, 2005
99.398 bln
+6.79 bln
7.33%
jan 1, 2006
106.303 bln
+6.905 bln
6.95%
jan 1, 2007
123.546 bln
+17.243 bln
16.22%
jan 1, 2008
139.885 bln
+16.339 bln
13.23%
jan 1, 2009
159.793 bln
+19.908 bln
14.23%
jan 1, 2010
158.639 bln
-1.154 bln
-0.72%
jan 1, 2011
159.653 bln
+1.014 bln
0.64%
jan 1, 2012
185.419 bln
+25.766 bln
16.14%
jan 1, 2013
207.912 bln
+22.493 bln
12.13%
jan 1, 2014
213.37 bln
+5.458 bln
2.63%
jan 1, 2015
220.625 bln
+7.255 bln
3.4%
Ranking of countries by current statistics by years


Comments: