29
/
en
AIzaSyAYiBZKx7MnpbEhh9jyipgxe19OcubqV5w
April 1, 2024
215767
Oman
OMN
true
2
1
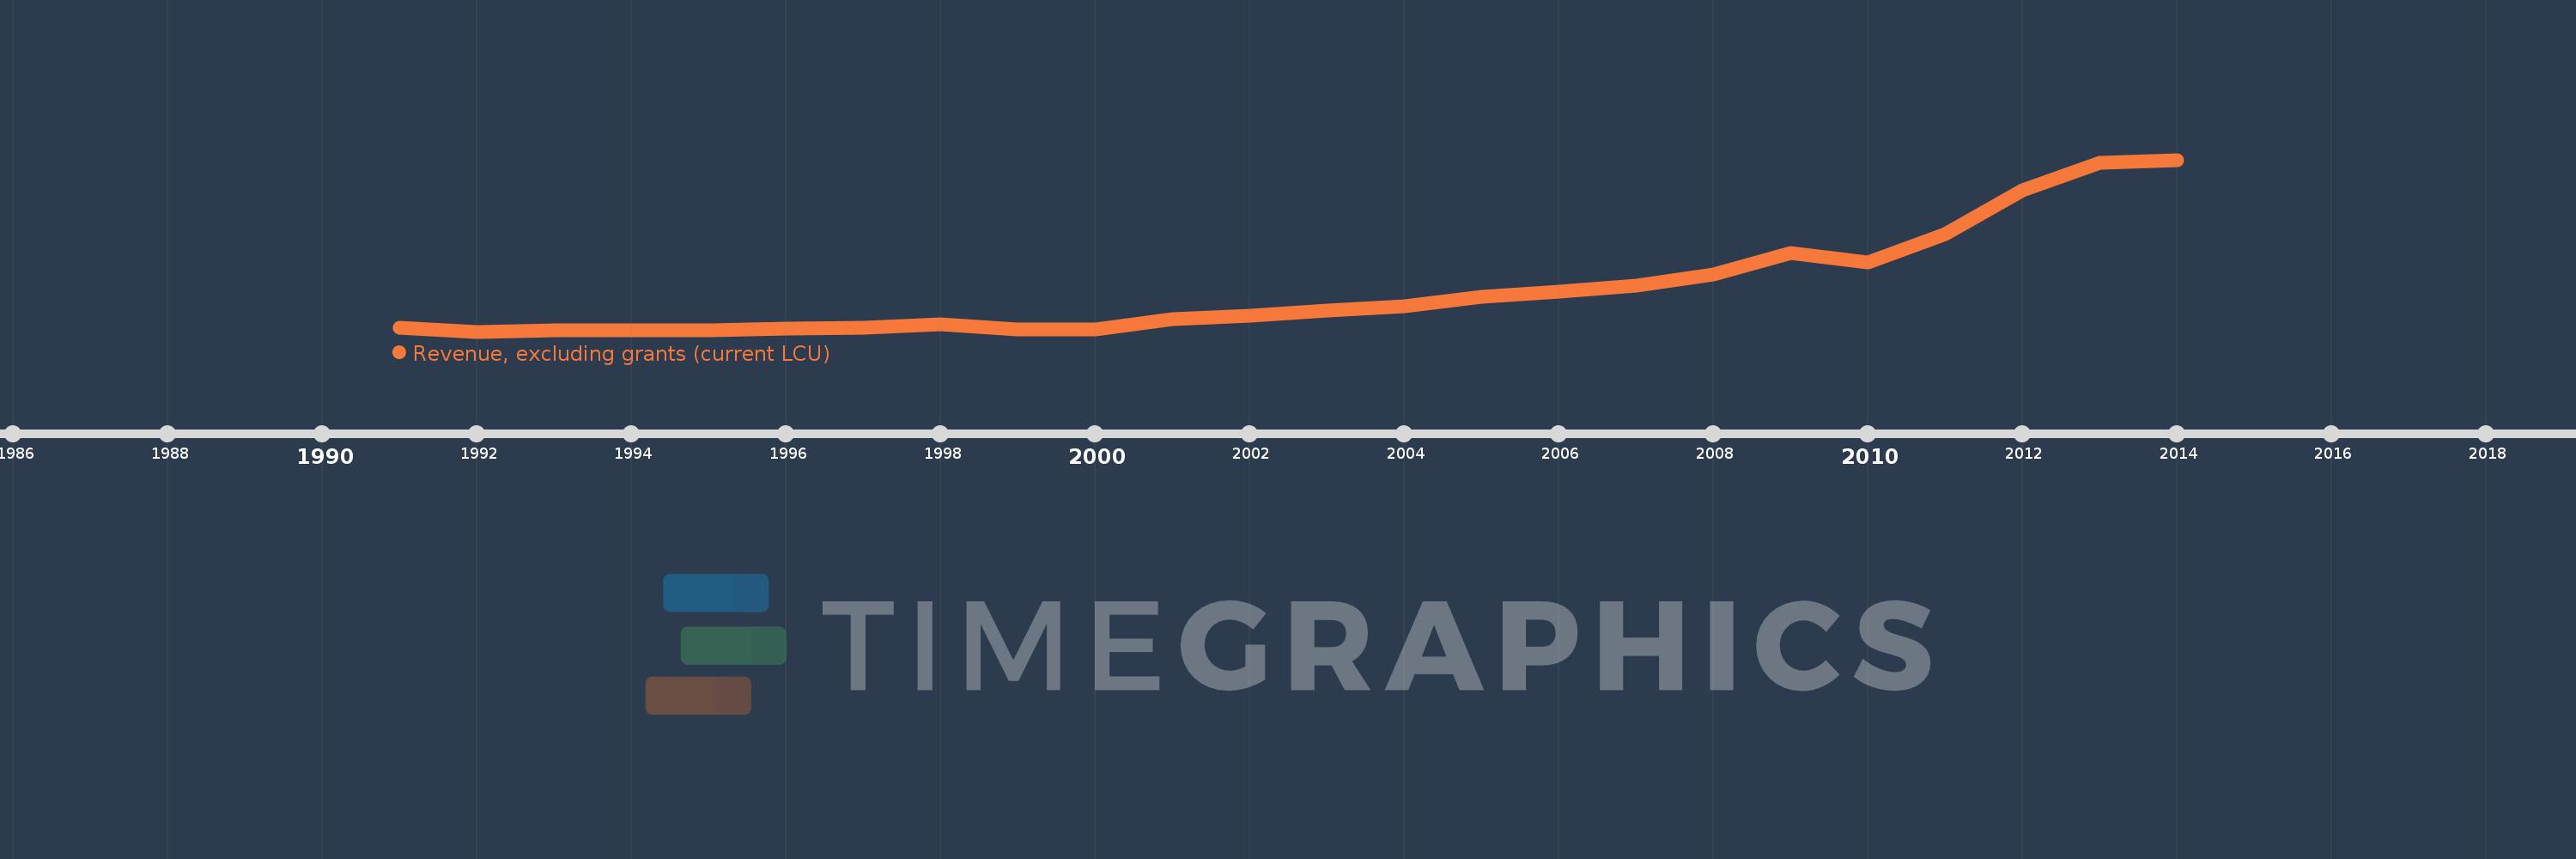
Revenue, excluding grants (current LCU)
2014,2013,2012,2011,2010,2009,2008,2007,2006,2005,2004,2003,2002,2001,2000,1999,1998,1997,1996,1995,1994,1993,1992,1991
This statistics in other country:
AfghanistanAlbaniaAlgeriaAngolaAntigua and BarbudaArgentinaArmeniaAustraliaAustriaAzerbaijanBahamas, TheBahrainBangladeshBarbadosBelarusBelgiumBelizeBeninBhutanBoliviaBosnia and HerzegovinaBotswanaBrazilBulgariaBurkina FasoBurundiCabo VerdeCambodiaCanadaCentral African RepublicChileChinaColombiaCongo, Dem. Rep.Congo, Rep.Costa RicaCote d'IvoireCroatiaCyprusCzech RepublicDenmarkDominicaDominican RepublicEgypt, Arab Rep.El SalvadorEquatorial GuineaEstoniaEthiopiaFijiFinlandFranceGambia, TheGeorgiaGermanyGhanaGreeceGrenadaGuatemalaHondurasHong Kong SAR, ChinaHungaryIcelandIndiaIndonesiaIran, Islamic Rep.IraqIrelandIsraelItalyJamaicaJapanJordanKazakhstanKenyaKiribatiKorea, Rep.KuwaitKyrgyz RepublicLao PDRLatviaLebanonLesothoLiberiaLithuaniaLuxembourgMacao SAR, ChinaMacedonia, FYRMadagascarMalawiMalaysiaMaldivesMaliMaltaMauritiusMexicoMicronesia, Fed. Sts.MoldovaMongoliaMoroccoMozambiqueMyanmarNamibiaNepalNetherlandsNew ZealandNicaraguaNigeriaNorwayOmanPakistanPanamaPapua New GuineaParaguayPeruPhilippinesPolandPortugalQatarRomaniaRussian FederationRwandaSamoaSan MarinoSao Tome and PrincipeSenegalSerbiaSeychellesSierra LeoneSingaporeSlovak RepublicSloveniaSolomon IslandsSouth AfricaSpainSri LankaSt. Kitts and NevisSt. LuciaSt. Vincent and the GrenadinesSurinameSwazilandSwedenSwitzerlandSyrian Arab RepublicTajikistanTanzaniaThailandTimor-LesteTogoTrinidad and TobagoTunisiaTurkeyUgandaUkraineUnited Arab EmiratesUnited KingdomUnited StatesUruguayVanuatuVenezuela, RBVietnamWest Bank and GazaYemen, Rep.ZambiaZimbabwe Timeline:
This timeline shows a graph from 1991 to 2014 of Oman. No data until 1990. Number of actual observations by date: 24.
Source name:
World Development Indicators
Source organization:
International Monetary Fund, Government Finance Statistics Yearbook and data files.
Categories, topics:
Public Sector
Last updated:
apr 23, 2017
Indicators value changes by year
Minimum:
1.254 bln
jan 1, 1992
Maximum:
14.989 bln
jan 1, 2014
At the date of observation
Value
Absolute change
Change from previous value
jan 1, 1991
1.574 bln
+1.574 bln
0.0%
jan 1, 1992
1.254 bln
-319.6 mln
-20.31%
jan 1, 1993
1.33 bln
+76.2 mln
6.08%
jan 1, 1994
1.35 bln
+19.9 mln
1.5%
jan 1, 1995
1.38 bln
+29.7 mln
2.2%
jan 1, 1996
1.476 bln
+96.2 mln
6.97%
jan 1, 1997
1.591 bln
+114.8 mln
7.78%
jan 1, 1998
1.857 bln
+265.501 mln
16.69%
jan 1, 1999
1.415 bln
-441.901 mln
-23.8%
jan 1, 2000
1.395 bln
-20.1 mln
-1.42%
jan 1, 2001
2.25 bln
+855.2 mln
61.33%
jan 1, 2002
2.517 bln
+267.6 mln
11.89%
jan 1, 2003
2.953 bln
+435.2 mln
17.29%
jan 1, 2004
3.28 bln
+328.0 mln
11.11%
jan 1, 2005
4.006 bln
+725.7 mln
22.12%
jan 1, 2006
4.444 bln
+437.6 mln
10.92%
jan 1, 2007
4.913 bln
+469.0 mln
10.55%
jan 1, 2008
5.834 bln
+921.2 mln
18.75%
jan 1, 2009
7.557 bln
+1.723 bln
29.53%
jan 1, 2010
6.753 bln
-804.0 mln
-10.64%
jan 1, 2011
9.042 bln
+2.289 bln
33.9%
jan 1, 2012
12.523 bln
+3.481 bln
38.5%
jan 1, 2013
14.76 bln
+2.238 bln
17.87%
jan 1, 2014
14.989 bln
+228.5 mln
1.55%
Ranking of countries by current statistics by years


Comments: