29
/
en
AIzaSyAYiBZKx7MnpbEhh9jyipgxe19OcubqV5w
April 1, 2024
182518
Luxembourg
LUX
true
2
1
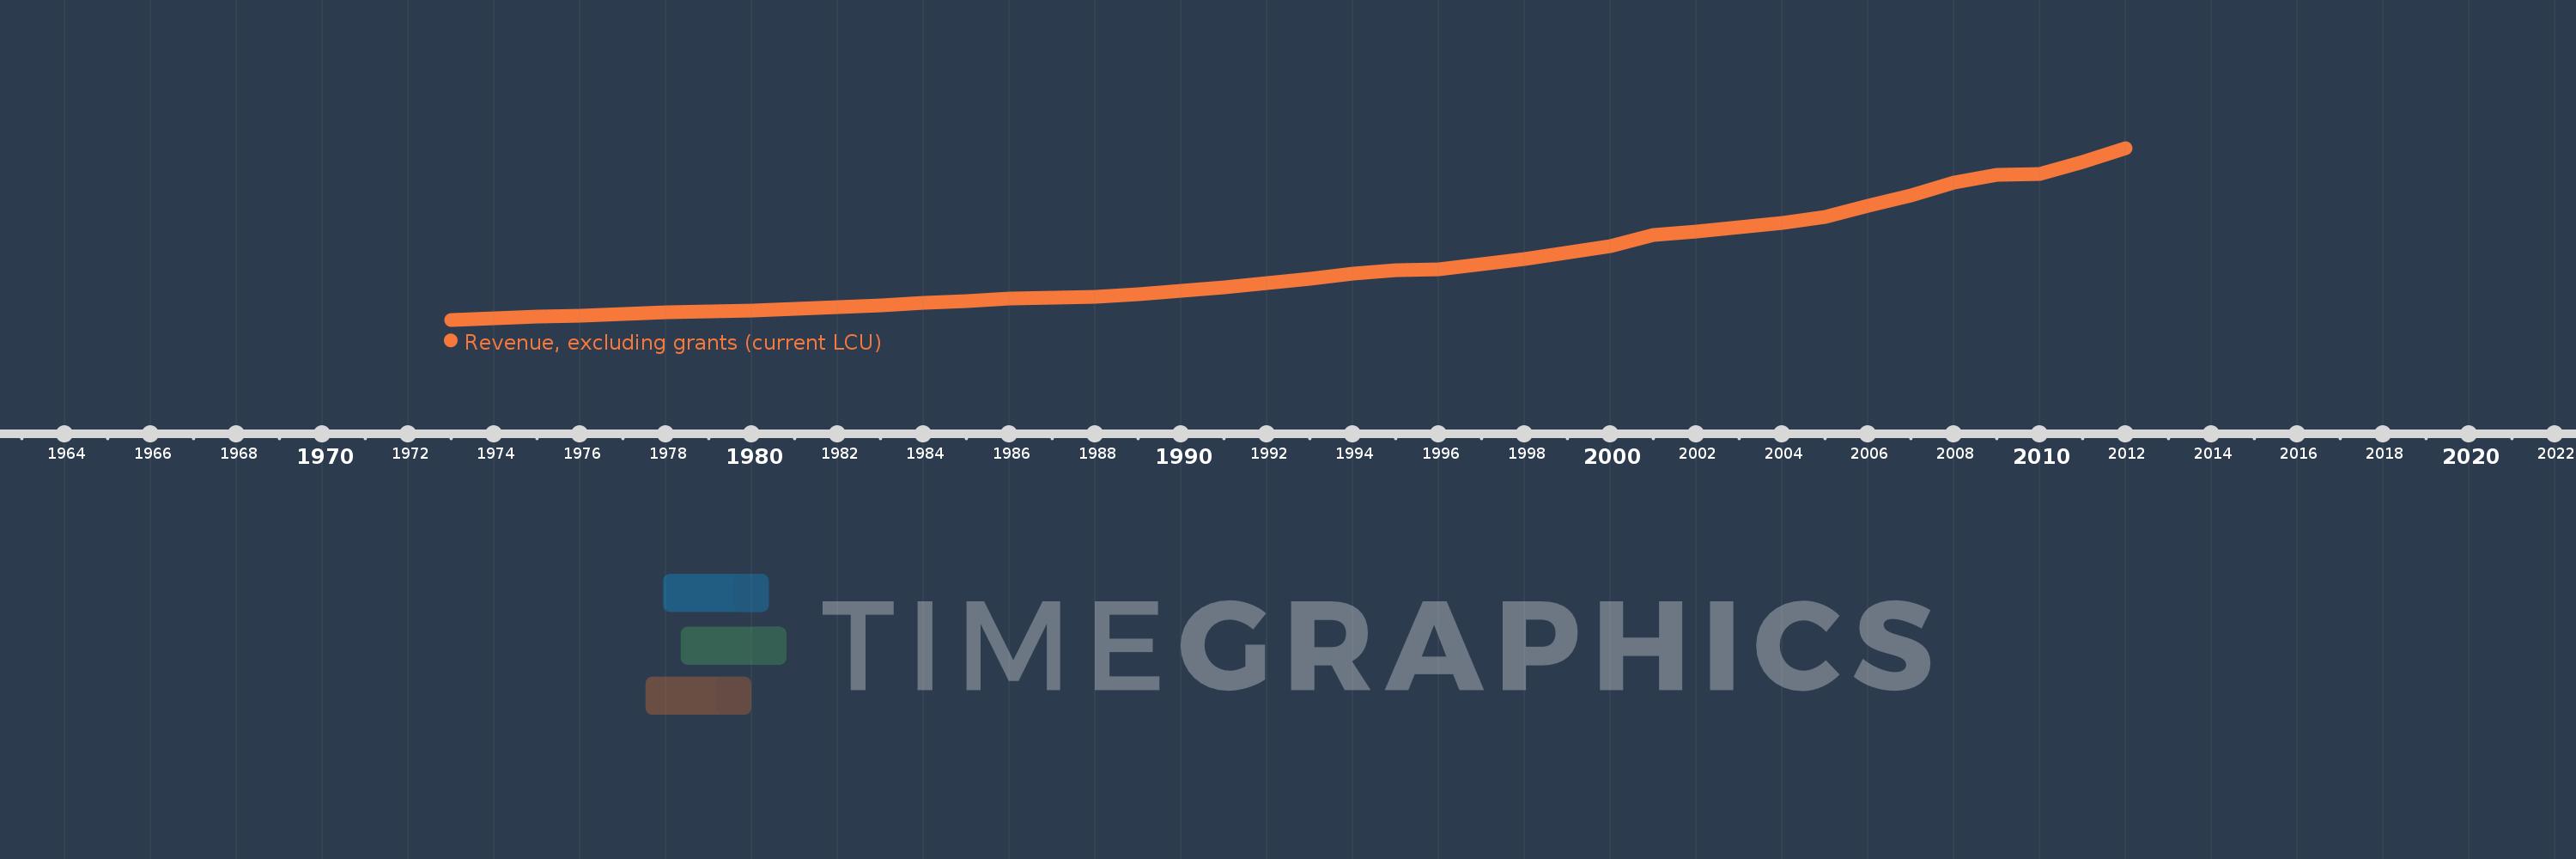
Revenue, excluding grants (current LCU)
2012,2011,2010,2009,2008,2007,2006,2005,2004,2003,2002,2001,2000,1998,1997,1996,1995,1994,1993,1992,1991,1990,1989,1988,1987,1986,1985,1984,1983,1982,1981,1980,1979,1978,1977,1976,1975,1974,1973
This statistics in other country:
AfghanistanAlbaniaAlgeriaAngolaAntigua and BarbudaArgentinaArmeniaAustraliaAustriaAzerbaijanBahamas, TheBahrainBangladeshBarbadosBelarusBelgiumBelizeBeninBhutanBoliviaBosnia and HerzegovinaBotswanaBrazilBulgariaBurkina FasoBurundiCabo VerdeCambodiaCanadaCentral African RepublicChileChinaColombiaCongo, Dem. Rep.Congo, Rep.Costa RicaCote d'IvoireCroatiaCyprusCzech RepublicDenmarkDominicaDominican RepublicEgypt, Arab Rep.El SalvadorEquatorial GuineaEstoniaEthiopiaFijiFinlandFranceGambia, TheGeorgiaGermanyGhanaGreeceGrenadaGuatemalaHondurasHong Kong SAR, ChinaHungaryIcelandIndiaIndonesiaIran, Islamic Rep.IraqIrelandIsraelItalyJamaicaJapanJordanKazakhstanKenyaKiribatiKorea, Rep.KuwaitKyrgyz RepublicLao PDRLatviaLebanonLesothoLiberiaLithuaniaLuxembourgMacao SAR, ChinaMacedonia, FYRMadagascarMalawiMalaysiaMaldivesMaliMaltaMauritiusMexicoMicronesia, Fed. Sts.MoldovaMongoliaMoroccoMozambiqueMyanmarNamibiaNepalNetherlandsNew ZealandNicaraguaNigeriaNorwayOmanPakistanPanamaPapua New GuineaParaguayPeruPhilippinesPolandPortugalQatarRomaniaRussian FederationRwandaSamoaSan MarinoSao Tome and PrincipeSenegalSerbiaSeychellesSierra LeoneSingaporeSlovak RepublicSloveniaSolomon IslandsSouth AfricaSpainSri LankaSt. Kitts and NevisSt. LuciaSt. Vincent and the GrenadinesSurinameSwazilandSwedenSwitzerlandSyrian Arab RepublicTajikistanTanzaniaThailandTimor-LesteTogoTrinidad and TobagoTunisiaTurkeyUgandaUkraineUnited Arab EmiratesUnited KingdomUnited StatesUruguayVanuatuVenezuela, RBVietnamWest Bank and GazaYemen, Rep.ZambiaZimbabwe Timeline:
This timeline shows a graph from 1973 to 2012 of Luxembourg. No data until 1972. Number of actual observations by date: 39.
Source name:
World Development Indicators
Source organization:
International Monetary Fund, Government Finance Statistics Yearbook and data files.
Categories, topics:
Public Sector
Last updated:
apr 23, 2017
Indicators value changes by year
Minimum:
554.959 mln
jan 1, 1973
Maximum:
17.238 bln
jan 1, 2012
At the date of observation
Value
Absolute change
Change from previous value
jan 1, 1973
554.959 mln
+554.959 mln
0.0%
jan 1, 1974
678.46 mln
+123.501 mln
22.25%
jan 1, 1975
847.077 mln
+168.617 mln
24.85%
jan 1, 1976
950.3 mln
+103.223 mln
12.19%
jan 1, 1977
1.107 bln
+156.346 mln
16.45%
jan 1, 1978
1.25 bln
+143.035 mln
12.93%
jan 1, 1979
1.389 bln
+139.713 mln
11.18%
jan 1, 1980
1.439 bln
+49.405 mln
3.56%
jan 1, 1981
1.642 bln
+203.198 mln
14.12%
jan 1, 1982
1.784 bln
+142.142 mln
8.66%
jan 1, 1983
1.964 bln
+180.02 mln
10.09%
jan 1, 1984
2.235 bln
+270.576 mln
13.78%
jan 1, 1985
2.393 bln
+158.007 mln
7.07%
jan 1, 1986
2.592 bln
+199.529 mln
8.34%
jan 1, 1987
2.712 bln
+119.46 mln
4.61%
jan 1, 1988
2.819 bln
+107.115 mln
3.95%
jan 1, 1989
2.991 bln
+171.939 mln
6.1%
jan 1, 1990
3.359 bln
+367.998 mln
12.3%
jan 1, 1991
3.679 bln
+320.254 mln
9.53%
jan 1, 1992
4.088 bln
+408.479 mln
11.1%
jan 1, 1993
4.567 bln
+479.773 mln
11.74%
jan 1, 1994
4.995 bln
+428.186 mln
9.38%
jan 1, 1995
5.399 bln
+403.273 mln
8.07%
jan 1, 1996
5.432 bln
+33.416 mln
0.62%
jan 1, 1997
5.919 bln
+486.744 mln
8.96%
jan 1, 1998
6.481 bln
+562.049 mln
9.5%
jan 1, 2000
7.708 bln
+1.227 bln
18.93%
jan 1, 2001
8.757 bln
+1.049 bln
13.61%
jan 1, 2002
9.163 bln
+405.792 mln
4.63%
jan 1, 2003
9.545 bln
+382.232 mln
4.17%
jan 1, 2004
9.953 bln
+408.063 mln
4.28%
jan 1, 2005
10.529 bln
+575.605 mln
5.78%
jan 1, 2006
11.665 bln
+1.136 bln
10.79%
jan 1, 2007
12.597 bln
+932.398 mln
7.99%
jan 1, 2008
13.879 bln
+1.281 bln
10.17%
jan 1, 2009
14.655 bln
+775.913 mln
5.59%
jan 1, 2010
14.687 bln
+32.444 mln
0.22%
jan 1, 2011
15.857 bln
+1.17 bln
7.96%
jan 1, 2012
17.238 bln
+1.381 bln
8.71%
Ranking of countries by current statistics by years


Comments: