29
/
en
AIzaSyAYiBZKx7MnpbEhh9jyipgxe19OcubqV5w
April 1, 2024
73940
Austria
AUT
true
2
1
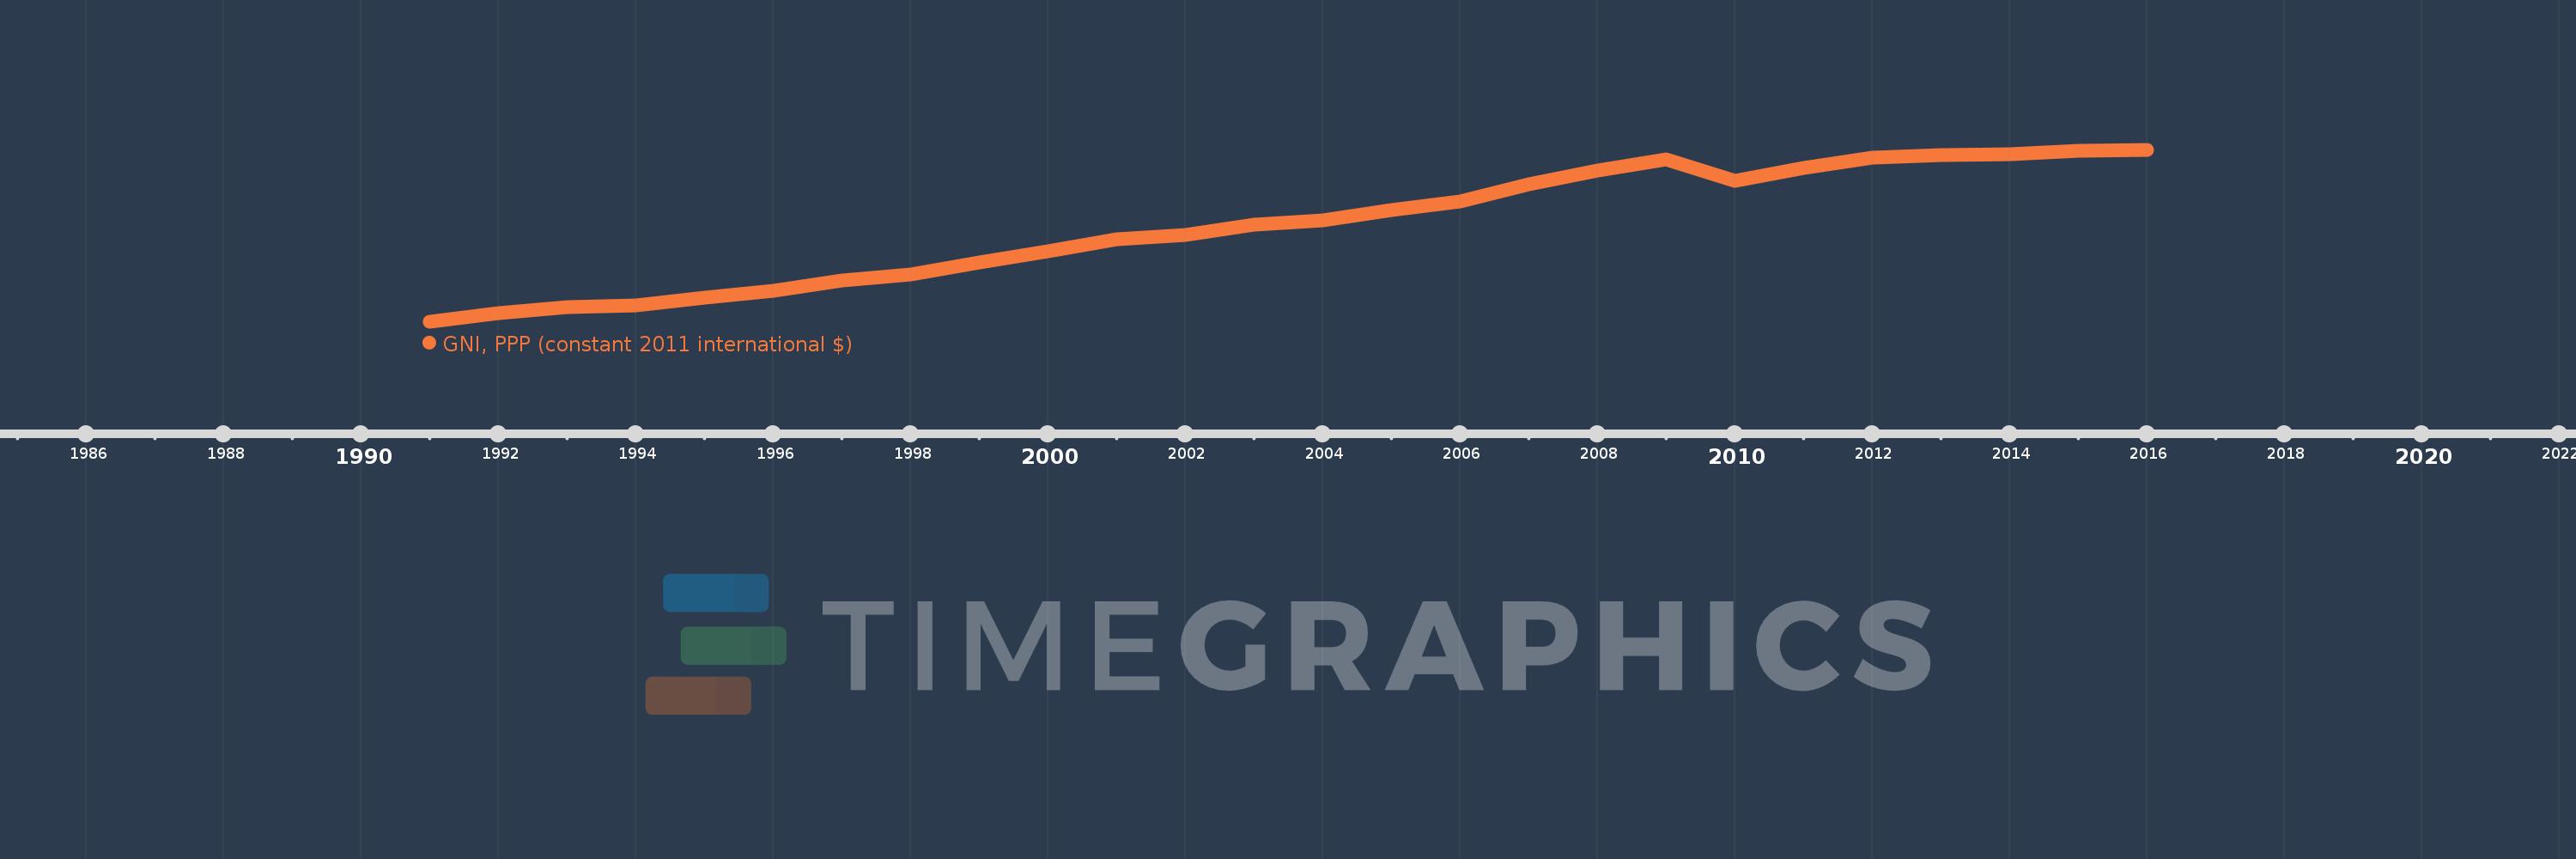
GNI, PPP (constant 2011 international $)
2016,2015,2014,2013,2012,2011,2010,2009,2008,2007,2006,2005,2004,2003,2002,2001,2000,1999,1998,1997,1996,1995,1994,1993,1992,1991
This statistics in other country:
AfghanistanAlbaniaAlgeriaAngolaAntigua and BarbudaArab WorldArgentinaArmeniaAustraliaAustriaAzerbaijanBahamas, TheBahrainBangladeshBarbadosBelarusBelgiumBelizeBeninBermudaBhutanBoliviaBosnia and HerzegovinaBotswanaBrazilBrunei DarussalamBulgariaBurkina FasoBurundiCabo VerdeCambodiaCameroonCanadaCaribbean small statesCentral African RepublicCentral Europe and the BalticsChadChileChinaColombiaComorosCongo, Dem. Rep.Congo, Rep.Costa RicaCote d'IvoireCroatiaCubaCyprusCzech RepublicDenmarkDominicaDominican RepublicEarly-demographic dividendEast Asia & PacificEast Asia & Pacific (excluding high income)East Asia & Pacific (IDA & IBRD countries)EcuadorEgypt, Arab Rep.El SalvadorEquatorial GuineaEritreaEstoniaEthiopiaEuro areaEurope & Central AsiaEurope & Central Asia (excluding high income)Europe & Central Asia (IDA & IBRD countries)European UnionFijiFinlandFranceGabonGambia, TheGeorgiaGermanyGhanaGreeceGrenadaGuatemalaGuineaGuinea-BissauGuyanaHaitiHeavily indebted poor countries (HIPC)High incomeHondurasHong Kong SAR, ChinaHungaryIBRD onlyIcelandIDA & IBRD totalIDA blendIDA onlyIDA totalIndiaIndonesiaIran, Islamic Rep.IraqIrelandIsraelItalyJamaicaJapanJordanKazakhstanKenyaKiribatiKorea, Rep.KosovoKuwaitKyrgyz RepublicLao PDRLate-demographic dividendLatin America & Caribbean Latin America & Caribbean (excluding high income)Latin America & the Caribbean (IDA & IBRD countries)LatviaLeast developed countries: UN classificationLebanonLesothoLiberiaLibyaLithuaniaLow & middle incomeLow incomeLower middle incomeLuxembourgMacao SAR, ChinaMacedonia, FYRMadagascarMalawiMalaysiaMaldivesMaliMaltaMarshall IslandsMauritaniaMauritiusMexicoMicronesia, Fed. Sts.Middle East & North AfricaMiddle East & North Africa (excluding high income)Middle East & North Africa (IDA & IBRD countries)Middle incomeMoldovaMongoliaMontenegroMoroccoMozambiqueMyanmarNamibiaNauruNepalNetherlandsNew ZealandNicaraguaNigerNigeriaNorth AmericaNorwayOECD membersOmanOther small statesPakistanPalauPanamaPapua New GuineaParaguayPeruPhilippinesPolandPortugalPost-demographic dividendPre-demographic dividendPuerto RicoQatarRomaniaRussian FederationRwandaSamoaSao Tome and PrincipeSaudi ArabiaSenegalSerbiaSeychellesSierra LeoneSingaporeSlovak RepublicSloveniaSmall statesSolomon IslandsSouth AfricaSouth AsiaSouth Asia (IDA & IBRD)South SudanSpainSri LankaSt. Kitts and NevisSt. LuciaSt. Vincent and the GrenadinesSub-Saharan Africa Sub-Saharan Africa (excluding high income)Sub-Saharan Africa (IDA & IBRD countries)SudanSurinameSwazilandSwedenSwitzerlandTajikistanTanzaniaThailandTimor-LesteTogoTongaTrinidad and TobagoTunisiaTurkeyTurkmenistanTuvaluUgandaUkraineUnited Arab EmiratesUnited KingdomUnited StatesUpper middle incomeUruguayUzbekistanVanuatuVenezuela, RBVietnamWest Bank and GazaWorldYemen, Rep.ZambiaZimbabwe Timeline:
This timeline shows a graph from 1991 to 2016 of Austria. No data until 1990. Number of actual observations by date: 26.
Source name:
World Development Indicators
Source organization:
World Bank, International Comparison Program database.
Categories, topics:
Economy & Growth
Last updated:
apr 23, 2017
Indicators value changes by year
Minimum:
241.491 bln
jan 1, 1991
Maximum:
378.447 bln
jan 1, 2016
At the date of observation
Value
Absolute change
Change from previous value
jan 1, 1991
241.491 bln
+241.491 bln
0.0%
jan 1, 1992
248.6 bln
+7.109 bln
2.94%
jan 1, 1993
253.454 bln
+4.854 bln
1.95%
jan 1, 1994
254.957 bln
+1.503 bln
0.59%
jan 1, 1995
260.586 bln
+5.629 bln
2.21%
jan 1, 1996
266.553 bln
+5.967 bln
2.29%
jan 1, 1997
274.335 bln
+7.781 bln
2.92%
jan 1, 1998
279.402 bln
+5.067 bln
1.85%
jan 1, 1999
288.734 bln
+9.333 bln
3.34%
jan 1, 2000
298.049 bln
+9.315 bln
3.23%
jan 1, 2001
307.762 bln
+9.713 bln
3.26%
jan 1, 2002
310.941 bln
+3.179 bln
1.03%
jan 1, 2003
318.796 bln
+7.855 bln
2.53%
jan 1, 2004
322.166 bln
+3.37 bln
1.06%
jan 1, 2005
331.024 bln
+8.859 bln
2.75%
jan 1, 2006
337.548 bln
+6.523 bln
1.97%
jan 1, 2007
350.93 bln
+13.382 bln
3.96%
jan 1, 2008
361.928 bln
+10.998 bln
3.13%
jan 1, 2009
370.941 bln
+9.013 bln
2.49%
jan 1, 2010
354.177 bln
-16.764 bln
-4.52%
jan 1, 2011
364.133 bln
+9.957 bln
2.81%
jan 1, 2012
372.487 bln
+8.354 bln
2.29%
jan 1, 2013
374.384 bln
+1.897 bln
0.51%
jan 1, 2014
375.423 bln
+1.039 bln
0.28%
jan 1, 2015
377.65 bln
+2.228 bln
0.59%
jan 1, 2016
378.447 bln
+796.769 mln
0.21%
Ranking of countries by current statistics by years


Comments: