29
/
en
AIzaSyAYiBZKx7MnpbEhh9jyipgxe19OcubqV5w
April 1, 2024
31609
Europe & Central Asia (excluding high income)
ECA
false
2
1
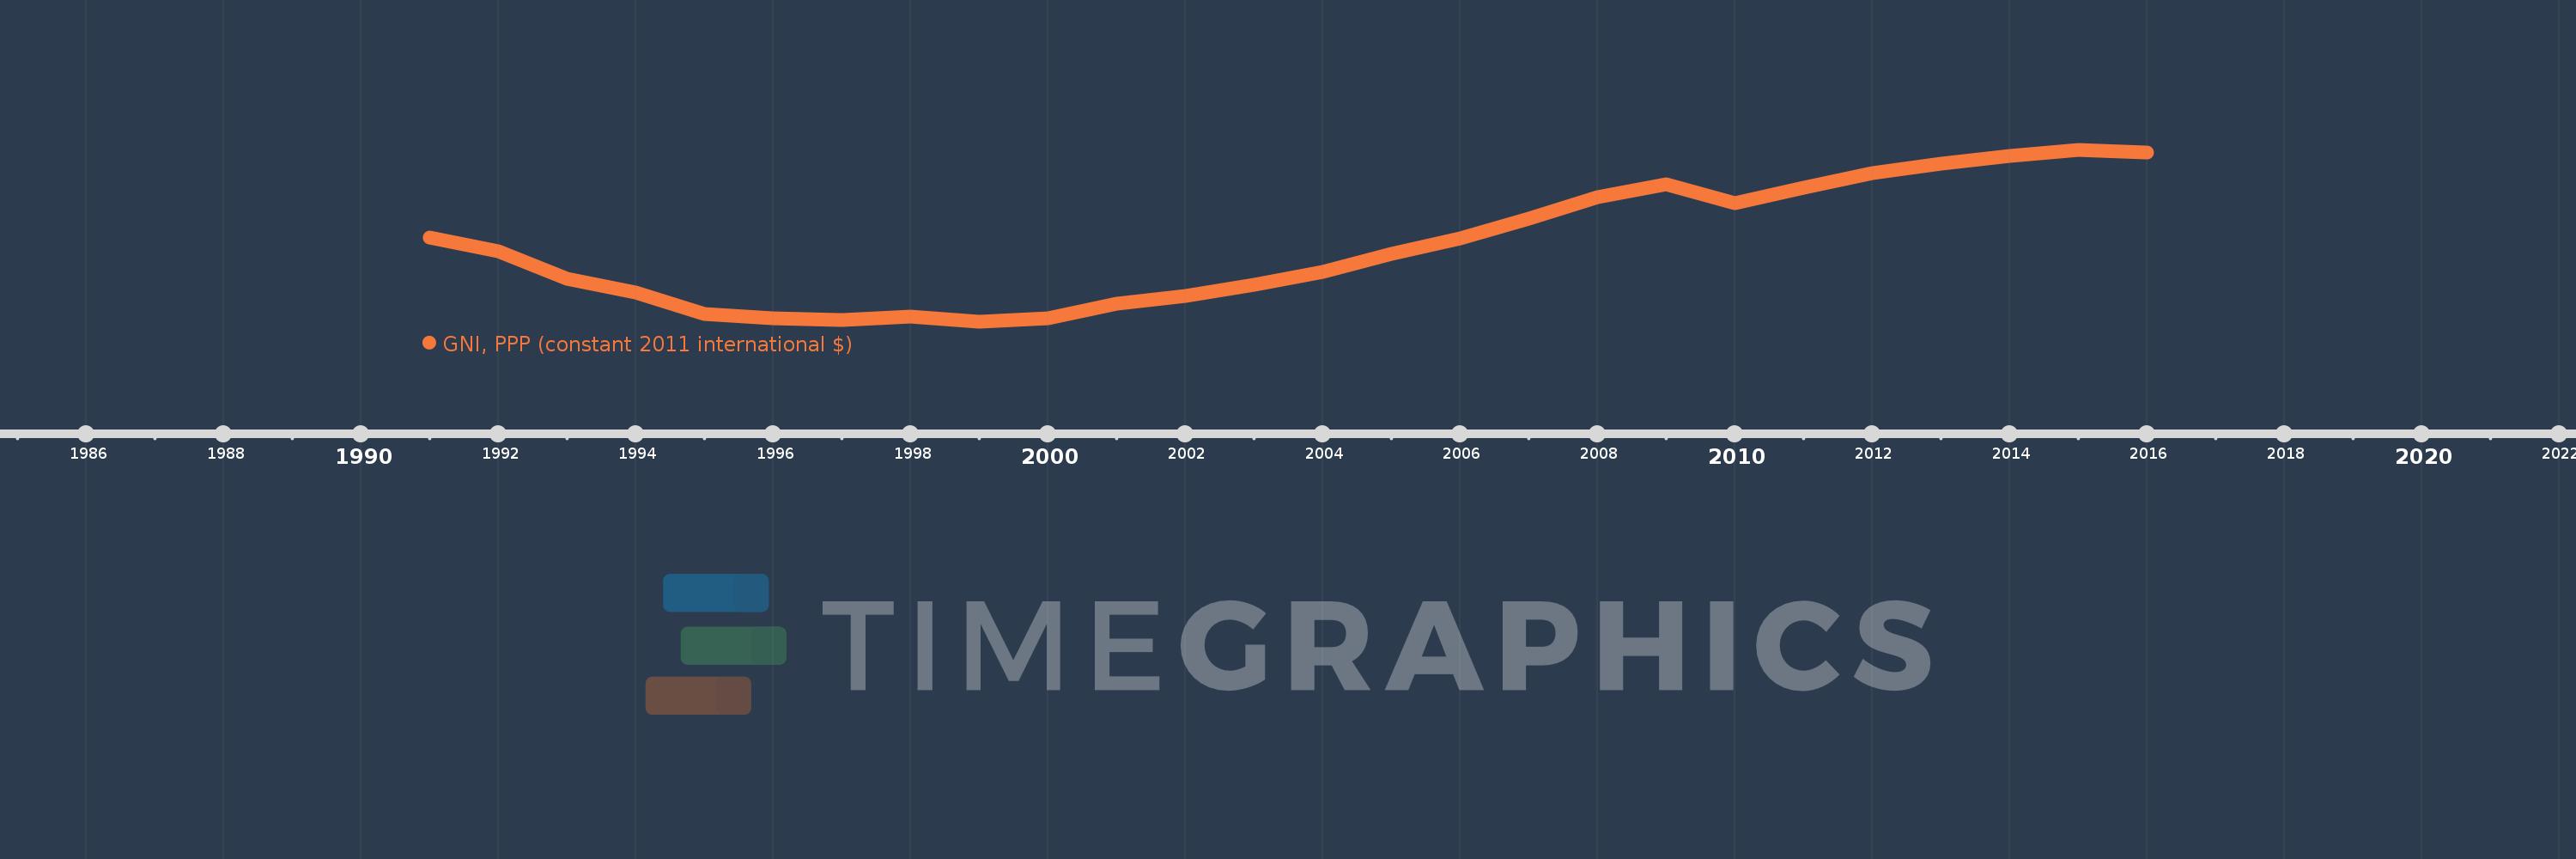
GNI, PPP (constant 2011 international $)
2016,2015,2014,2013,2012,2011,2010,2009,2008,2007,2006,2005,2004,2003,2002,2001,2000,1999,1998,1997,1996,1995,1994,1993,1992,1991
This statistics in other country:
AfghanistanAlbaniaAlgeriaAngolaAntigua and BarbudaArab WorldArgentinaArmeniaAustraliaAustriaAzerbaijanBahamas, TheBahrainBangladeshBarbadosBelarusBelgiumBelizeBeninBermudaBhutanBoliviaBosnia and HerzegovinaBotswanaBrazilBrunei DarussalamBulgariaBurkina FasoBurundiCabo VerdeCambodiaCameroonCanadaCaribbean small statesCentral African RepublicCentral Europe and the BalticsChadChileChinaColombiaComorosCongo, Dem. Rep.Congo, Rep.Costa RicaCote d'IvoireCroatiaCubaCyprusCzech RepublicDenmarkDominicaDominican RepublicEarly-demographic dividendEast Asia & PacificEast Asia & Pacific (excluding high income)East Asia & Pacific (IDA & IBRD countries)EcuadorEgypt, Arab Rep.El SalvadorEquatorial GuineaEritreaEstoniaEthiopiaEuro areaEurope & Central AsiaEurope & Central Asia (excluding high income)Europe & Central Asia (IDA & IBRD countries)European UnionFijiFinlandFranceGabonGambia, TheGeorgiaGermanyGhanaGreeceGrenadaGuatemalaGuineaGuinea-BissauGuyanaHaitiHeavily indebted poor countries (HIPC)High incomeHondurasHong Kong SAR, ChinaHungaryIBRD onlyIcelandIDA & IBRD totalIDA blendIDA onlyIDA totalIndiaIndonesiaIran, Islamic Rep.IraqIrelandIsraelItalyJamaicaJapanJordanKazakhstanKenyaKiribatiKorea, Rep.KosovoKuwaitKyrgyz RepublicLao PDRLate-demographic dividendLatin America & Caribbean Latin America & Caribbean (excluding high income)Latin America & the Caribbean (IDA & IBRD countries)LatviaLeast developed countries: UN classificationLebanonLesothoLiberiaLibyaLithuaniaLow & middle incomeLow incomeLower middle incomeLuxembourgMacao SAR, ChinaMacedonia, FYRMadagascarMalawiMalaysiaMaldivesMaliMaltaMarshall IslandsMauritaniaMauritiusMexicoMicronesia, Fed. Sts.Middle East & North AfricaMiddle East & North Africa (excluding high income)Middle East & North Africa (IDA & IBRD countries)Middle incomeMoldovaMongoliaMontenegroMoroccoMozambiqueMyanmarNamibiaNauruNepalNetherlandsNew ZealandNicaraguaNigerNigeriaNorth AmericaNorwayOECD membersOmanOther small statesPakistanPalauPanamaPapua New GuineaParaguayPeruPhilippinesPolandPortugalPost-demographic dividendPre-demographic dividendPuerto RicoQatarRomaniaRussian FederationRwandaSamoaSao Tome and PrincipeSaudi ArabiaSenegalSerbiaSeychellesSierra LeoneSingaporeSlovak RepublicSloveniaSmall statesSolomon IslandsSouth AfricaSouth AsiaSouth Asia (IDA & IBRD)South SudanSpainSri LankaSt. Kitts and NevisSt. LuciaSt. Vincent and the GrenadinesSub-Saharan Africa Sub-Saharan Africa (excluding high income)Sub-Saharan Africa (IDA & IBRD countries)SudanSurinameSwazilandSwedenSwitzerlandTajikistanTanzaniaThailandTimor-LesteTogoTongaTrinidad and TobagoTunisiaTurkeyTurkmenistanTuvaluUgandaUkraineUnited Arab EmiratesUnited KingdomUnited StatesUpper middle incomeUruguayUzbekistanVanuatuVenezuela, RBVietnamWest Bank and GazaWorldYemen, Rep.ZambiaZimbabwe Timeline:
This timeline shows a graph from 1991 to 2016 of Europe & Central Asia (excluding high income). No data until 1990. Number of actual observations by date: 26.
Source name:
World Development Indicators
Source organization:
World Bank, International Comparison Program database.
Categories, topics:
Economy & Growth
Last updated:
apr 23, 2017
Indicators value changes by year
Minimum:
3.507 trl
jan 1, 1999
Maximum:
7.068 trl
jan 1, 2015
At the date of observation
Value
Absolute change
Change from previous value
jan 1, 1991
5.249 trl
+5.249 trl
0.0%
jan 1, 1992
4.972 trl
-276.892 bln
-5.28%
jan 1, 1993
4.395 trl
-576.587 bln
-11.6%
jan 1, 1994
4.12 trl
-275.271 bln
-6.26%
jan 1, 1995
3.677 trl
-442.758 bln
-10.75%
jan 1, 1996
3.592 trl
-84.966 bln
-2.31%
jan 1, 1997
3.554 trl
-38.829 bln
-1.08%
jan 1, 1998
3.618 trl
+64.353 bln
1.81%
jan 1, 1999
3.507 trl
-110.834 bln
-3.06%
jan 1, 2000
3.586 trl
+78.632 bln
2.24%
jan 1, 2001
3.893 trl
+307.575 bln
8.58%
jan 1, 2002
4.054 trl
+160.295 bln
4.12%
jan 1, 2003
4.271 trl
+217.605 bln
5.37%
jan 1, 2004
4.536 trl
+265.059 bln
6.21%
jan 1, 2005
4.926 trl
+389.71 bln
8.59%
jan 1, 2006
5.246 trl
+320.39 bln
6.5%
jan 1, 2007
5.642 trl
+395.716 bln
7.54%
jan 1, 2008
6.095 trl
+452.725 bln
8.02%
jan 1, 2009
6.353 trl
+257.933 bln
4.23%
jan 1, 2010
5.973 trl
-379.411 bln
-5.97%
jan 1, 2011
6.286 trl
+312.641 bln
5.23%
jan 1, 2012
6.596 trl
+310.428 bln
4.94%
jan 1, 2013
6.782 trl
+185.62 bln
2.81%
jan 1, 2014
6.949 trl
+167.38 bln
2.47%
jan 1, 2015
7.068 trl
+118.181 bln
1.7%
jan 1, 2016
7.02 trl
-47.561 bln
-0.67%
Ranking of countries by current statistics by years


Comments: