29
/
en
AIzaSyAYiBZKx7MnpbEhh9jyipgxe19OcubqV5w
April 1, 2024
245618
South Africa
ZAF
true
2
1
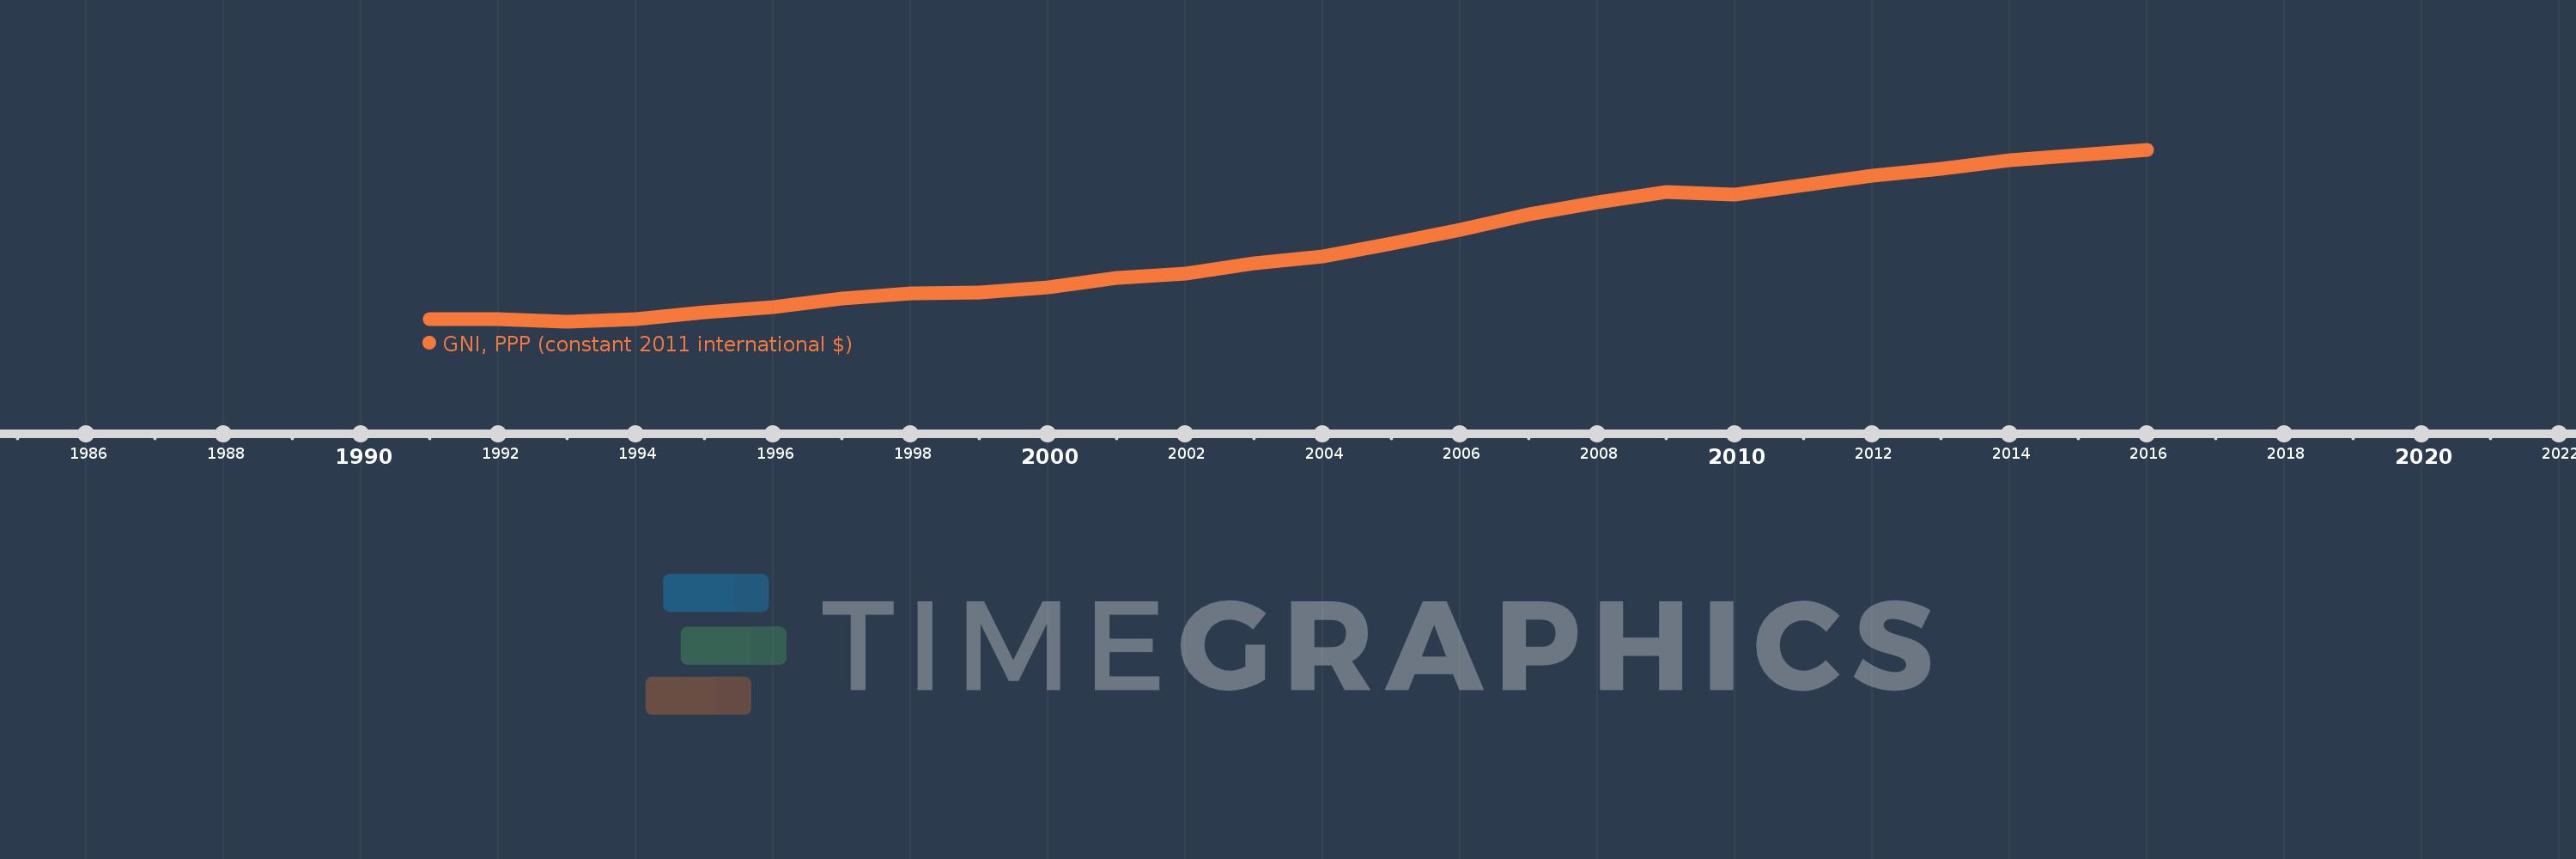
GNI, PPP (constant 2011 international $)
2016,2015,2014,2013,2012,2011,2010,2009,2008,2007,2006,2005,2004,2003,2002,2001,2000,1999,1998,1997,1996,1995,1994,1993,1992,1991
This statistics in other country:
AfghanistanAlbaniaAlgeriaAngolaAntigua and BarbudaArab WorldArgentinaArmeniaAustraliaAustriaAzerbaijanBahamas, TheBahrainBangladeshBarbadosBelarusBelgiumBelizeBeninBermudaBhutanBoliviaBosnia and HerzegovinaBotswanaBrazilBrunei DarussalamBulgariaBurkina FasoBurundiCabo VerdeCambodiaCameroonCanadaCaribbean small statesCentral African RepublicCentral Europe and the BalticsChadChileChinaColombiaComorosCongo, Dem. Rep.Congo, Rep.Costa RicaCote d'IvoireCroatiaCubaCyprusCzech RepublicDenmarkDominicaDominican RepublicEarly-demographic dividendEast Asia & PacificEast Asia & Pacific (excluding high income)East Asia & Pacific (IDA & IBRD countries)EcuadorEgypt, Arab Rep.El SalvadorEquatorial GuineaEritreaEstoniaEthiopiaEuro areaEurope & Central AsiaEurope & Central Asia (excluding high income)Europe & Central Asia (IDA & IBRD countries)European UnionFijiFinlandFranceGabonGambia, TheGeorgiaGermanyGhanaGreeceGrenadaGuatemalaGuineaGuinea-BissauGuyanaHaitiHeavily indebted poor countries (HIPC)High incomeHondurasHong Kong SAR, ChinaHungaryIBRD onlyIcelandIDA & IBRD totalIDA blendIDA onlyIDA totalIndiaIndonesiaIran, Islamic Rep.IraqIrelandIsraelItalyJamaicaJapanJordanKazakhstanKenyaKiribatiKorea, Rep.KosovoKuwaitKyrgyz RepublicLao PDRLate-demographic dividendLatin America & Caribbean Latin America & Caribbean (excluding high income)Latin America & the Caribbean (IDA & IBRD countries)LatviaLeast developed countries: UN classificationLebanonLesothoLiberiaLibyaLithuaniaLow & middle incomeLow incomeLower middle incomeLuxembourgMacao SAR, ChinaMacedonia, FYRMadagascarMalawiMalaysiaMaldivesMaliMaltaMarshall IslandsMauritaniaMauritiusMexicoMicronesia, Fed. Sts.Middle East & North AfricaMiddle East & North Africa (excluding high income)Middle East & North Africa (IDA & IBRD countries)Middle incomeMoldovaMongoliaMontenegroMoroccoMozambiqueMyanmarNamibiaNauruNepalNetherlandsNew ZealandNicaraguaNigerNigeriaNorth AmericaNorwayOECD membersOmanOther small statesPakistanPalauPanamaPapua New GuineaParaguayPeruPhilippinesPolandPortugalPost-demographic dividendPre-demographic dividendPuerto RicoQatarRomaniaRussian FederationRwandaSamoaSao Tome and PrincipeSaudi ArabiaSenegalSerbiaSeychellesSierra LeoneSingaporeSlovak RepublicSloveniaSmall statesSolomon IslandsSouth AfricaSouth AsiaSouth Asia (IDA & IBRD)South SudanSpainSri LankaSt. Kitts and NevisSt. LuciaSt. Vincent and the GrenadinesSub-Saharan Africa Sub-Saharan Africa (excluding high income)Sub-Saharan Africa (IDA & IBRD countries)SudanSurinameSwazilandSwedenSwitzerlandTajikistanTanzaniaThailandTimor-LesteTogoTongaTrinidad and TobagoTunisiaTurkeyTurkmenistanTuvaluUgandaUkraineUnited Arab EmiratesUnited KingdomUnited StatesUpper middle incomeUruguayUzbekistanVanuatuVenezuela, RBVietnamWest Bank and GazaWorldYemen, Rep.ZambiaZimbabwe Timeline:
This timeline shows a graph from 1991 to 2016 of South Africa. No data until 1990. Number of actual observations by date: 26.
Source name:
World Development Indicators
Source organization:
World Bank, International Comparison Program database.
Categories, topics:
Economy & Growth
Last updated:
apr 23, 2017
Indicators value changes by year
Minimum:
345.597 bln
jan 1, 1993
Maximum:
664.929 bln
jan 1, 2016
At the date of observation
Value
Absolute change
Change from previous value
jan 1, 1991
351.203 bln
+351.203 bln
0.0%
jan 1, 1992
351.647 bln
+444.008 mln
0.13%
jan 1, 1993
345.597 bln
-6.05 bln
-1.72%
jan 1, 1994
350.858 bln
+5.261 bln
1.52%
jan 1, 1995
362.938 bln
+12.08 bln
3.44%
jan 1, 1996
373.84 bln
+10.902 bln
3.0%
jan 1, 1997
388.885 bln
+15.044 bln
4.02%
jan 1, 1998
399.03 bln
+10.145 bln
2.61%
jan 1, 1999
400.368 bln
+1.338 bln
0.34%
jan 1, 2000
409.86 bln
+9.492 bln
2.37%
jan 1, 2001
427.231 bln
+17.371 bln
4.24%
jan 1, 2002
435.626 bln
+8.395 bln
1.96%
jan 1, 2003
454.441 bln
+18.815 bln
4.32%
jan 1, 2004
466.806 bln
+12.365 bln
2.72%
jan 1, 2005
491.5 bln
+24.694 bln
5.29%
jan 1, 2006
517.257 bln
+25.757 bln
5.24%
jan 1, 2007
546.16 bln
+28.904 bln
5.59%
jan 1, 2008
567.618 bln
+21.458 bln
3.93%
jan 1, 2009
586.543 bln
+18.926 bln
3.33%
jan 1, 2010
582.288 bln
-4.255 bln
-0.73%
jan 1, 2011
600.437 bln
+18.149 bln
3.12%
jan 1, 2012
617.169 bln
+16.732 bln
2.79%
jan 1, 2013
630.021 bln
+12.852 bln
2.08%
jan 1, 2014
645.457 bln
+15.436 bln
2.45%
jan 1, 2015
655.721 bln
+10.264 bln
1.59%
jan 1, 2016
664.929 bln
+9.209 bln
1.4%
Ranking of countries by current statistics by years


Comments: