29
/
en
AIzaSyAYiBZKx7MnpbEhh9jyipgxe19OcubqV5w
April 1, 2024
66031
Algeria
DZA
true
2
1
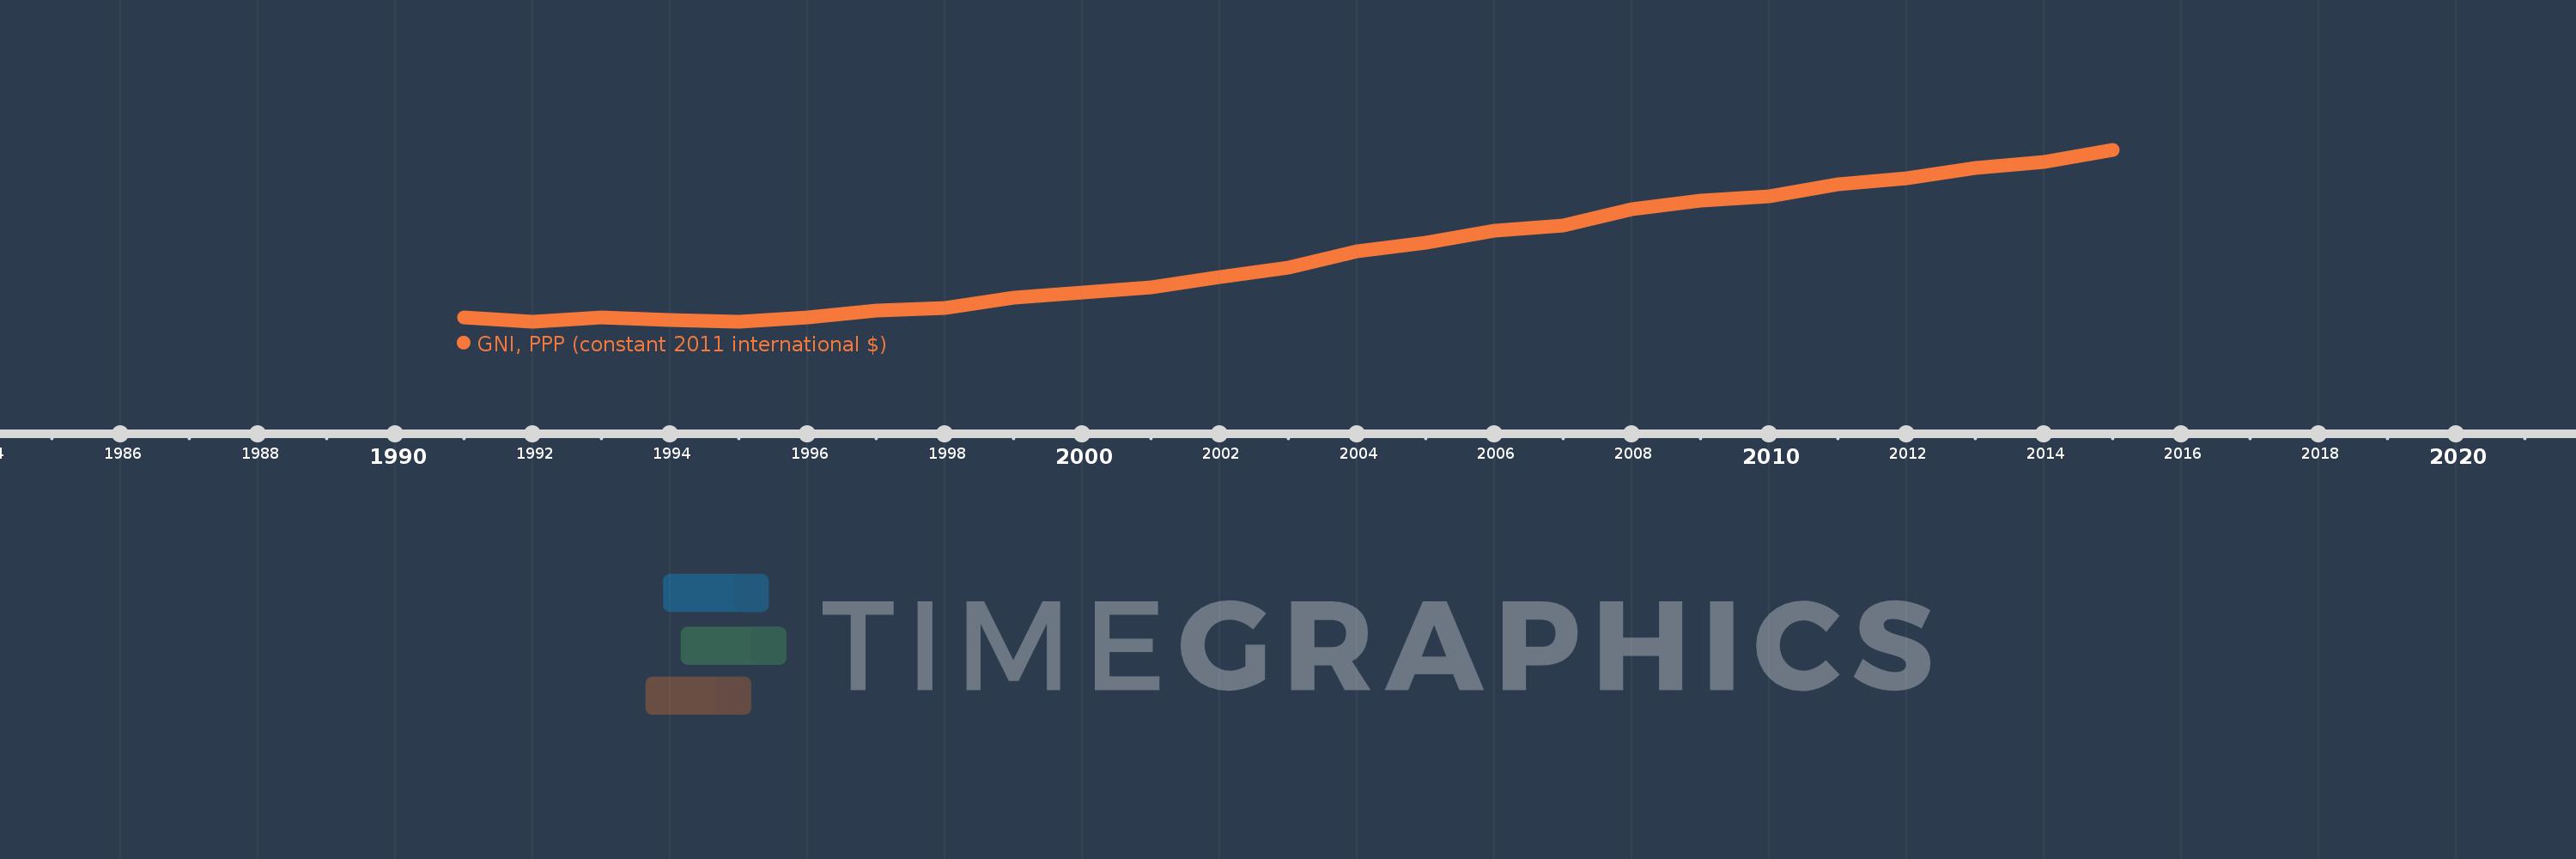
GNI, PPP (constant 2011 international $)
2015,2014,2013,2012,2011,2010,2009,2008,2007,2006,2005,2004,2003,2002,2001,2000,1999,1998,1997,1996,1995,1994,1993,1992,1991
This statistics in other country:
AfghanistanAlbaniaAlgeriaAngolaAntigua and BarbudaArab WorldArgentinaArmeniaAustraliaAustriaAzerbaijanBahamas, TheBahrainBangladeshBarbadosBelarusBelgiumBelizeBeninBermudaBhutanBoliviaBosnia and HerzegovinaBotswanaBrazilBrunei DarussalamBulgariaBurkina FasoBurundiCabo VerdeCambodiaCameroonCanadaCaribbean small statesCentral African RepublicCentral Europe and the BalticsChadChileChinaColombiaComorosCongo, Dem. Rep.Congo, Rep.Costa RicaCote d'IvoireCroatiaCubaCyprusCzech RepublicDenmarkDominicaDominican RepublicEarly-demographic dividendEast Asia & PacificEast Asia & Pacific (excluding high income)East Asia & Pacific (IDA & IBRD countries)EcuadorEgypt, Arab Rep.El SalvadorEquatorial GuineaEritreaEstoniaEthiopiaEuro areaEurope & Central AsiaEurope & Central Asia (excluding high income)Europe & Central Asia (IDA & IBRD countries)European UnionFijiFinlandFranceGabonGambia, TheGeorgiaGermanyGhanaGreeceGrenadaGuatemalaGuineaGuinea-BissauGuyanaHaitiHeavily indebted poor countries (HIPC)High incomeHondurasHong Kong SAR, ChinaHungaryIBRD onlyIcelandIDA & IBRD totalIDA blendIDA onlyIDA totalIndiaIndonesiaIran, Islamic Rep.IraqIrelandIsraelItalyJamaicaJapanJordanKazakhstanKenyaKiribatiKorea, Rep.KosovoKuwaitKyrgyz RepublicLao PDRLate-demographic dividendLatin America & Caribbean Latin America & Caribbean (excluding high income)Latin America & the Caribbean (IDA & IBRD countries)LatviaLeast developed countries: UN classificationLebanonLesothoLiberiaLibyaLithuaniaLow & middle incomeLow incomeLower middle incomeLuxembourgMacao SAR, ChinaMacedonia, FYRMadagascarMalawiMalaysiaMaldivesMaliMaltaMarshall IslandsMauritaniaMauritiusMexicoMicronesia, Fed. Sts.Middle East & North AfricaMiddle East & North Africa (excluding high income)Middle East & North Africa (IDA & IBRD countries)Middle incomeMoldovaMongoliaMontenegroMoroccoMozambiqueMyanmarNamibiaNauruNepalNetherlandsNew ZealandNicaraguaNigerNigeriaNorth AmericaNorwayOECD membersOmanOther small statesPakistanPalauPanamaPapua New GuineaParaguayPeruPhilippinesPolandPortugalPost-demographic dividendPre-demographic dividendPuerto RicoQatarRomaniaRussian FederationRwandaSamoaSao Tome and PrincipeSaudi ArabiaSenegalSerbiaSeychellesSierra LeoneSingaporeSlovak RepublicSloveniaSmall statesSolomon IslandsSouth AfricaSouth AsiaSouth Asia (IDA & IBRD)South SudanSpainSri LankaSt. Kitts and NevisSt. LuciaSt. Vincent and the GrenadinesSub-Saharan Africa Sub-Saharan Africa (excluding high income)Sub-Saharan Africa (IDA & IBRD countries)SudanSurinameSwazilandSwedenSwitzerlandTajikistanTanzaniaThailandTimor-LesteTogoTongaTrinidad and TobagoTunisiaTurkeyTurkmenistanTuvaluUgandaUkraineUnited Arab EmiratesUnited KingdomUnited StatesUpper middle incomeUruguayUzbekistanVanuatuVenezuela, RBVietnamWest Bank and GazaWorldYemen, Rep.ZambiaZimbabwe Timeline:
This timeline shows a graph from 1991 to 2015 of Algeria. No data until 1990. Number of actual observations by date: 25.
Source name:
World Development Indicators
Source organization:
World Bank, International Comparison Program database.
Categories, topics:
Economy & Growth
Last updated:
apr 23, 2017
Indicators value changes by year
Minimum:
250.928 bln
jan 1, 1995
Maximum:
516.656 bln
jan 1, 2015
At the date of observation
Value
Absolute change
Change from previous value
jan 1, 1991
258.202 bln
+258.202 bln
0.0%
jan 1, 1992
251.771 bln
-6.431 bln
-2.49%
jan 1, 1993
257.511 bln
+5.739 bln
2.28%
jan 1, 1994
254.359 bln
-3.152 bln
-1.22%
jan 1, 1995
250.928 bln
-3.431 bln
-1.35%
jan 1, 1996
258.241 bln
+7.313 bln
2.91%
jan 1, 1997
268.015 bln
+9.774 bln
3.79%
jan 1, 1998
272.651 bln
+4.636 bln
1.73%
jan 1, 1999
288.292 bln
+15.641 bln
5.74%
jan 1, 2000
296.176 bln
+7.884 bln
2.73%
jan 1, 2001
304.815 bln
+8.639 bln
2.92%
jan 1, 2002
319.837 bln
+15.022 bln
4.93%
jan 1, 2003
335.357 bln
+15.52 bln
4.85%
jan 1, 2004
359.769 bln
+24.412 bln
7.28%
jan 1, 2005
373.369 bln
+13.6 bln
3.78%
jan 1, 2006
392.381 bln
+19.012 bln
5.09%
jan 1, 2007
400.687 bln
+8.306 bln
2.12%
jan 1, 2008
425.345 bln
+24.658 bln
6.15%
jan 1, 2009
438.095 bln
+12.75 bln
3.0%
jan 1, 2010
445.143 bln
+7.048 bln
1.61%
jan 1, 2011
463.977 bln
+18.834 bln
4.23%
jan 1, 2012
473.77 bln
+9.794 bln
2.11%
jan 1, 2013
488.974 bln
+15.204 bln
3.21%
jan 1, 2014
499.093 bln
+10.119 bln
2.07%
jan 1, 2015
516.656 bln
+17.563 bln
3.52%
Ranking of countries by current statistics by years


Comments: